
DIY Color Densitometer
The densitometer circuit integrates the TCS-230 optical sensor, which consists of a 4x16 matrix of 64 photodiodes, with the Basic Stamp II microcontroller. The TCS-230's architecture allows for the selection of red, green, blue, or clear sensor arrays through control lines S2 and S3. Additionally, the electronic iris is controlled by S0 and S1, enabling the adjustment of sensitivity based on ambient light conditions.
The output from the TCS-230 is a series of pulses whose frequency correlates directly with the intensity of light detected, reaching frequencies of up to 500 kHz. This high-frequency output provides a resolution equivalent to 12 to 14 bits, surpassing the capabilities of traditional analog-to-digital converters. The microcontroller processes these pulses to derive meaningful data regarding film density and other photographic parameters.
For practical implementation, the Basic Stamp II microcontroller is programmed to facilitate communication with a computer via its serial port. This allows for the seamless transfer of data into Microsoft Excel, where users can visualize and analyze the readings. The integration of the StampDAQ macro enhances user experience by enabling real-time graphing and calculations.
The design also considers the use of a white LED for illumination, which minimizes the need for additional filters such as the Hoya CM500 infrared blocking filter. This choice is supported by Texas Advanced Optical, confirming that the infrared spectrum is largely absent when using a white LED source.
In summary, this densitometer design represents a significant advancement in the field of photography, making it accessible for amateur photographers to obtain precise measurements of film density and other critical parameters, thus enhancing their darkroom capabilities.A densitometer is one of the most valuable tools a darkroom enthusiast can employ. Up until recently, however, densitometers were expensive and bulky. Furthermore, densitometers which would talk to your computer and calculate effective film speed, contrast index or gamma were beyond the reach of almost all amateurs. Easily programmed microprocesso rs and the availability of highly accurate, inexpensive photodiodes make it possible for the photographer to build a densitometer which is reliable, accurate and inexpensive. The unit described here uses a new RGB photo-sensor, actually a 64 photodiode matrix with an incorporated light to frequency converter, the Texas Advanced Optical TCS-230 to greatly simplify the task.
We chose to use the Basic Stamp II from Parallax Inc. as the microcontroller for this project since the device is relatively easy to program (it can be programmed right on the densitometer circuit board without having to be removed). If you ever get bored with the densitometer application for the Basic Stamp II you can always press it into service in another device.
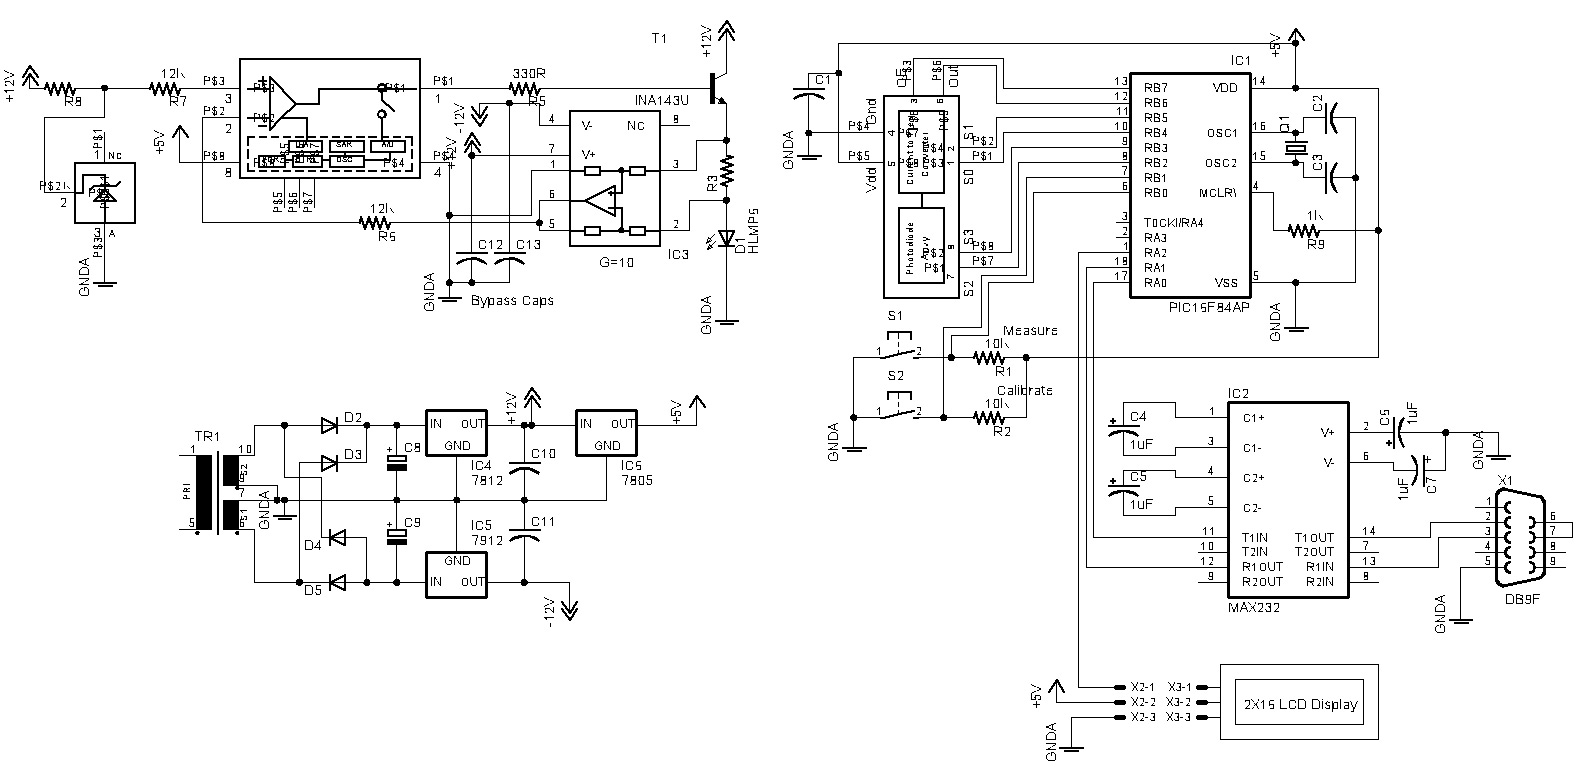
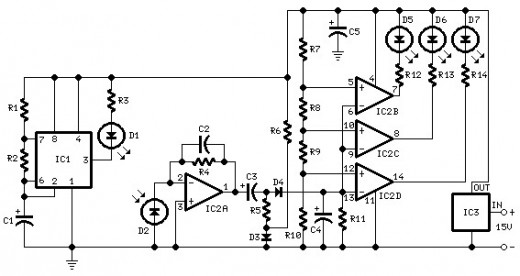
An outline of the Computing Densitometer is shown below: The outline above shows the several control lines from the Basic Stamp II to the TCS230 photo-receptor. The TCS230 integrated circuit has five input lines: two for color measurement, two to control the TCS230 electronic iris, and an Output Enable line (/OE).
There is one data line and, of course, power and ground lines. The design presented in this article uses the Basic Stamp II to talk to your computer via its serial port, placing the data directly into a Microsoft Excel spreadsheet. Parallax makes available free to users of the Basic Stamp an Excel Macro which accepts the data into your PC from.
The macro, StampDAQ can be downloaded from the Parallax website. With the macro in place, you can plot the data and calculate information in real time for determining film and development parameters, or in later use while printing. While Excel can be used to convert the raw light readings into the logarithmic values which photographers are accustomed to using, we have incorporated a routine in the program which does so that log values can be seen on the LCD display.
If there is enough interest we will modify the transmission densitometer to take reflection measurements. It`s my opinion that transmission and reflection densitometers are, as Perry Como sung like a horse and carriage, you can`t have one without the other!
The TAOS TCS230 optical sensor consists of 64 individual photodiodes in a 4 by 16 matrix. Light impinging on the sensor is converted to current which is, in turn, converted to a square wave whose frequency is proportionate to the intensity of the light. A block diagram is shown below: IIn the diagram above, S2 and S3 are used to select the Red, Green, Blue or Clear arrays of sensors.
S0 and S1 control the iris of the photodetector, allowing the unit`s sensitivity to be tailored to the level of light impinging upon the photodiodes. The response graph for the TCS230, including a Hoya CM500 (Infrared blocking) filter, is shown below: Since a white LED is used to illuminate the negative, the Hoya filter is unnecessary as most of the infrared spectrum is absent.
Texas Advanced Optical confirms this view. The use of a light-to-frequency converter such as the TCS230 dispenses with the need for an expensive, high resolution analog to digital converter and its associated low-noise voltage reference since the output of the TCS230 is a series of pulses whose duration can be directly measured by the microcontroller. The frequency of the pulses is as high as 500kHz allowing the TCS230 to have far greater precision, on the order of 12 to 14 bits, than would be available for a device using an ADC.
In addition, techniques can be employed to average the measurements, reducing the effects of random noise in measurements. The illumination 🔗 External reference
Related Circuits
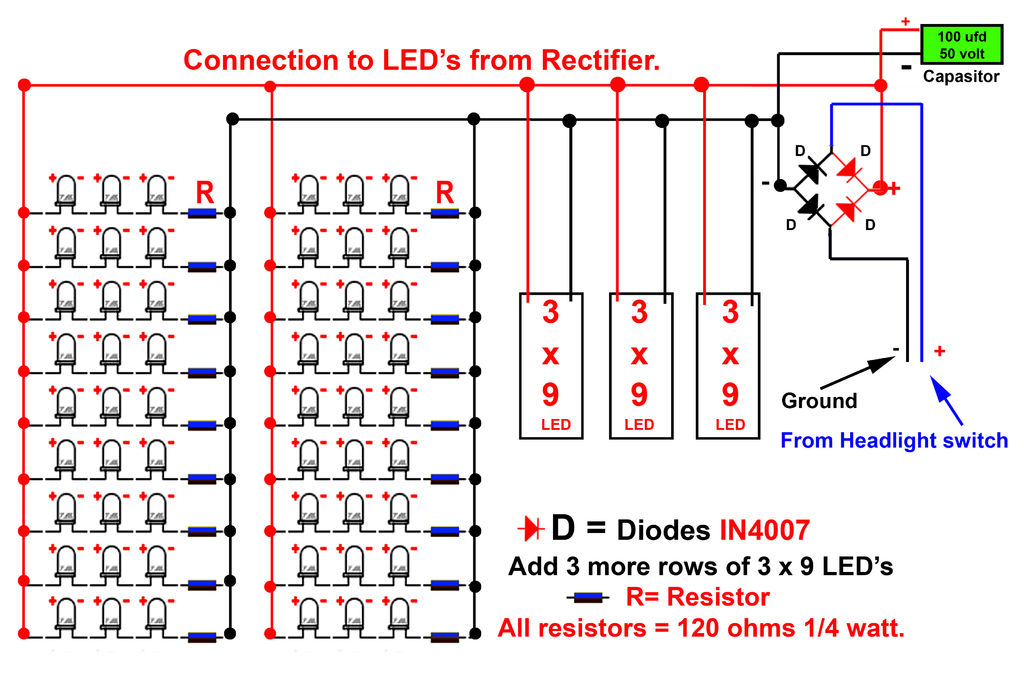
Gently bend the leads of the LEDs and, using the provided schematic circuit diagram, begin to solder. Once soldering is complete, it should... To successfully assemble the LED circuit, it is essential to follow a systematic approach. Start by preparing...
There is information not included in this main post. Read through the thread for more information on timer calibration and other useful information by cpfers. PEU pointed out that the TX should be connected to serial port pin 2...
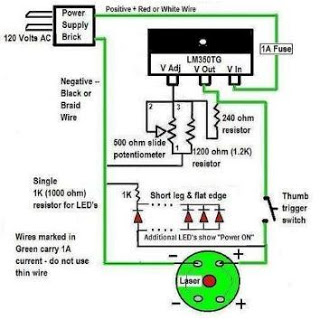
A DIY espionage kit is not complete without a long-distance listening device, particularly one that incorporates a laser. This project demonstrates how to utilize a laser pointer to capture sounds from hundreds of feet away. The materials required include...
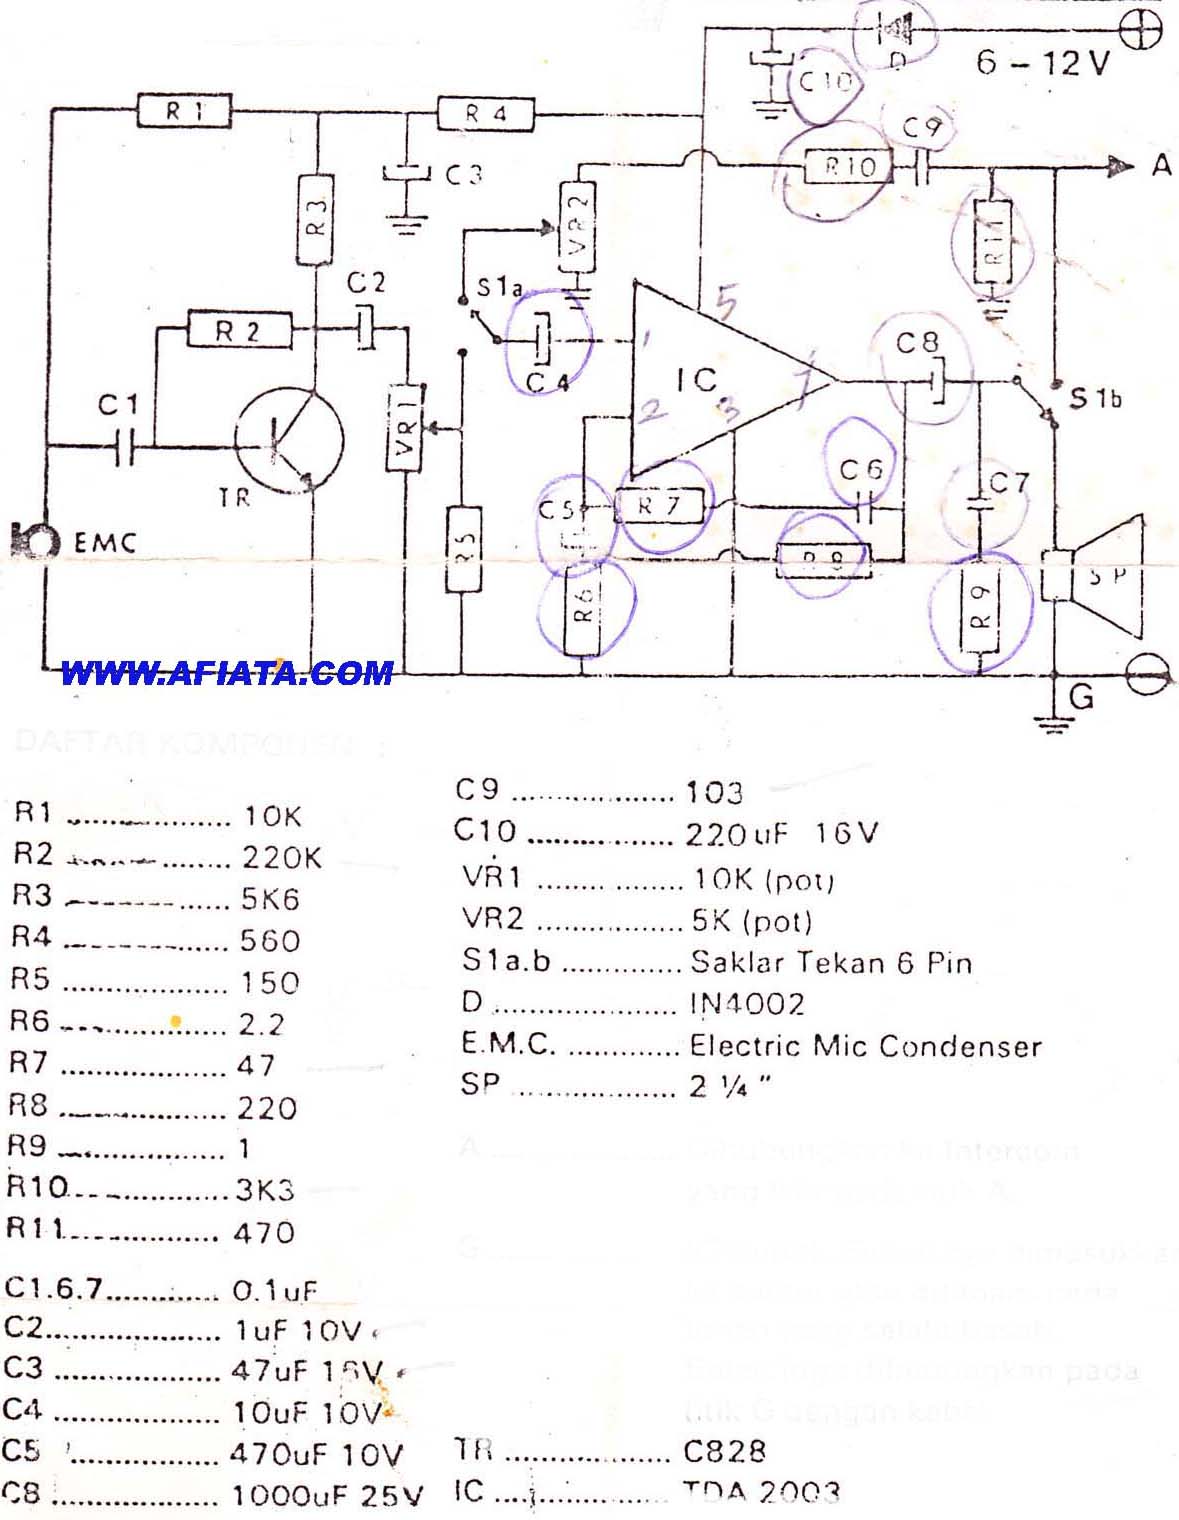
DIY Intercom Circuit Full-duplex intercom circuit schematic, cable on the way to the intercom circuit. The DIY intercom circuit is designed to facilitate two-way communication using a full-duplex system. This allows simultaneous transmission and reception of audio signals, enabling clear...
The color wheel and motor control are customizable. This system utilizes field-sequential color rather than the "compatible color" introduced later. Following the wiring modifications, further details about the color wheel will be provided. Without the wheel, CBS shows can...
Read the article and learn how to create a parking sensor for only $4.99. To design a cost-effective parking sensor, a basic understanding of ultrasonic sensor technology is essential. The parking sensor system typically consists of an ultrasonic sensor, a...