
Audio Filter Analyzer
This circuit is designed to analyze the frequency response of a filter using an oscilloscope. The operation begins with a frequency sweep that ranges from low to high, which is applied to the filter. The oscilloscope captures the output of the filter, allowing for a visual representation of how the filter responds to varying frequencies.
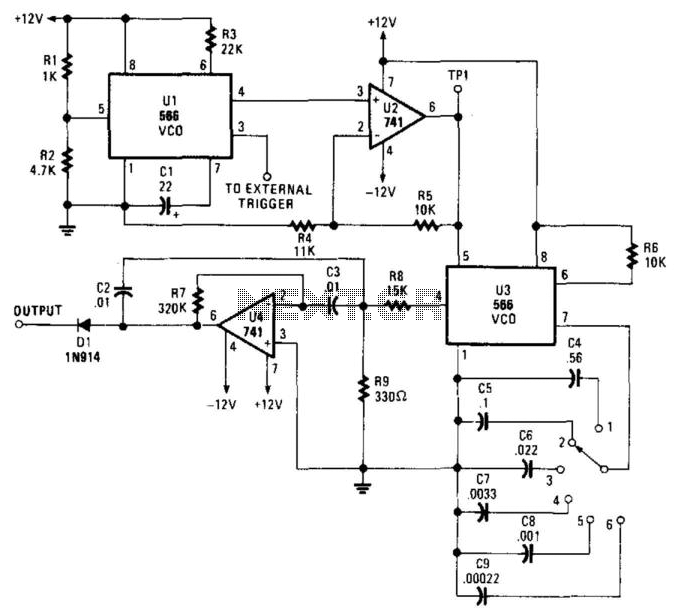
The 566 VCO (U1) plays a crucial role in generating a VLF triangle wave that modulates the frequency of the next stage in the circuit. In addition, this VCO outputs a square wave that serves as an external trigger for the oscilloscope, ensuring synchronization between the sweep and the displayed output.
Operational amplifier U2, based on the 741 model, is utilized to optimize the output signal's amplitude and DC offset, ensuring that the oscilloscope receives a clean and accurate representation of the filter's output. The second VCO (U3) is responsible for generating the sweeping triangle wave, with its frequency adjustable via switch S1, allowing for flexibility in testing different frequency ranges.
Operational amplifier U4 is configured as a bandpass filter, providing an example of how the circuit can be used to analyze specific frequency bands. This filter setup is essential for visualizing how the filter responds as the input frequency approaches, reaches, and surpasses the bandpass range.
Diode D1 is included in the circuit to modify the output waveform, effectively clipping the lower half and resulting in a bell-shaped curve. This modification is significant for visual clarity on the oscilloscope, making it easier to analyze the filter's performance.
To operate the circuit, proper settings on the oscilloscope are necessary. The TIME/CM should be set to 50 ms/cm, and the VOLTS/CM control adjusted to 2 V, providing a suitable scale for observing the frequency sweep. The triggering configuration is also critical; by connecting the probe from the circuit's trigger to the oscilloscope's external trigger input and setting the triggering mode to normal, external, the oscilloscope can accurately display the frequency response.
After establishing the initial connections and settings, the probe should be moved from test point TP1 to the filter output past the diode. This transition allows for the observation of the filter's response as the frequency sweep progresses, providing valuable insights into the filter's characteristics and performance. When this circuit is connected to a filter and an oscilloscope, the scope displays the filter"s frequency response. A frequency that sweeps from low to high is applied to a filter. An oscilloscope is triggered by* the start of the sweep and ends its trace at the highest frequency of the sweep. The filter output goes to the vertical amplifier of the oscilloscope. Using bandpass filters as an example, as the bandpass frequency is approached, reached, and passed, the scope follows the peaking output and draws the response curve.
A neat effect! The 566 VCO (Ul) produces a VLF triangle wave to frequency modulate the next stage. It also produces a square wave to externally trigger the scope. Op amp U2 (a 741 unit) optimizes the amplitude and the dc component. Another VCO (U3) produces the actual sweeping triangle wave. Its frequency is selectable via SI. Op amp U4 (another 741 op amp) is set up as a bandpass filter and has been included as an example filter. Finally, diode D1 chops off the bottom half of the output, and leaves a nice bell curve. lb set up and operate, power-up the circuit and scope. Set the scope"s TIME/CM to 50 ms/cm. Set the VOLTS/CM control to 2 V. Attach a probe from the circuit"s trigger to the scope"s external trigger input. Set the triggering mode to normal, external. Attach a probe from the vertical amplifier to TP1. You"ll see a diagonal line that runs across the CRT. Input coupling should be set to dc. Adjust the triggering level until the diagonal runs from the upper left to the lower right of the CRT to ensure a displayed sweep from low to high.
Now, disconnect the probe from TP1 and attach it to the filter output past the diode. 🔗 External reference
Related Circuits
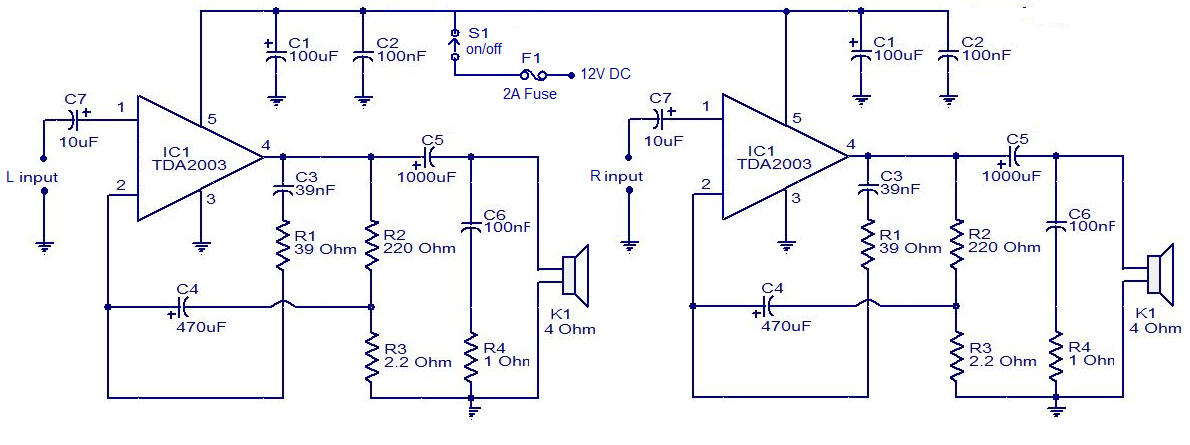
The circuit is easy to construct. The TDA2003 is an integrated radio amplifier from ST Microelectronics that features short circuit protection for all pins, thermal protection, low harmonic distortion, and low crossover distortion. In the circuit provided, the TDA2003...
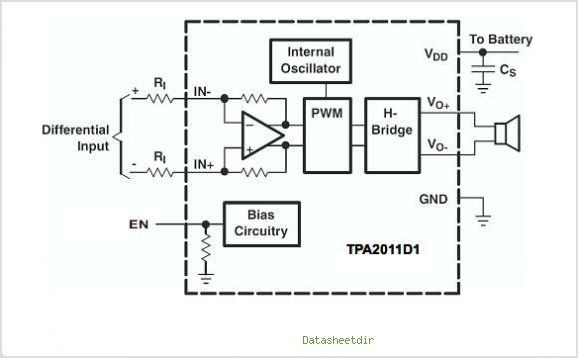
The TPA3007D1 is a 6.5-W mono bridge-tied load (BTL) class-D audio power amplifier featuring high efficiency, which eliminates the need for heat sinks. This amplifier can drive 8-ohm speakers with only a ferrite bead filter required to reduce electromagnetic...
This circuit can be directly connected to CD players, tuners, and tape recorders. It requires the addition of a 10K logarithmic potentiometer (dual gang for stereo) and a switch to accommodate various sources. Proper grounding is crucial to eliminate...
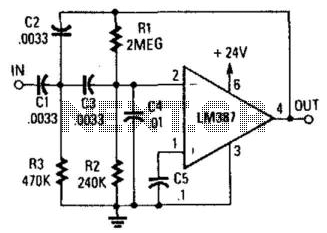
This circuit is a two-section active high-pass filter using an LM387, with a cutoff frequency below 50 Hz at a slope of 12 dB per octave. It will help reduce rumble caused by turntable defects in record systems. The two-section...
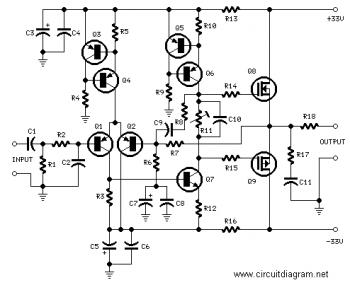
The TDA7294 amplifier module is a monolithic integrated circuit designed for use as a Class AB audio amplifier in high-fidelity applications. It features a wide voltage range and output current capability, allowing it to deliver high power to both...

Useful circuit for self-powered speakers, radios, and TVs; can be used as a car power amplifier. Here is the schematic for an 8-watt audio power amplifier. The described circuit serves as an 8-watt audio power amplifier, suitable for various applications,...