Butterworth Filter Design
1. Definition of Filters
1.1 Definition of Filters
Filters are essential components in various engineering disciplines, particularly in electronics and signal processing. Their fundamental purpose is to allow certain frequencies of a signal to pass while attenuating others, thereby enabling the control of signal characteristics. In the context of electronics, filters can be used in many applications, including audio processing, communication systems, and instrumentation.
Filters can be classified into several categories based on their frequency response, including low-pass, high-pass, band-pass, and band-stop filters. Each type serves a specific purpose:
- Low-pass filters (LPF): Allow signals with frequencies below a certain cutoff frequency to pass while attenuating higher frequencies. They are widely used in applications where eliminating high-frequency noise is crucial, such as audio systems where they enhance the clarity of sound.
- High-pass filters (HPF): Allow signals with frequencies above a specific cutoff frequency to pass, effectively filtering out lower frequency components. This is invaluable in applications like eliminating rumble in audio recordings.
- Band-pass filters (BPF): Permit a specific range of frequencies to pass while attenuating frequencies outside this range. This is particularly useful in telecommunications, where isolating specific frequency bands is necessary for effective data transmission.
- Band-stop filters (BSF): Attenuate signals within a specific frequency band while allowing frequencies outside this band to pass. This can be important in radio communications to eliminate interference from unwanted frequencies.
Filters can be implemented using various methods, including passive components (resistors, capacitors, and inductors), active components (operational amplifiers), or digital signal processing techniques. The choice of implementation affects the filter's performance characteristics, such as its response time, stability, and the complexity of the design.
The Butterworth filter, made popular by its smooth frequency response and monotonic behavior, is notable for its maximally flat frequency response in the passband, making it a preferred choice in many applications. In more advanced contexts, filters can be designed with feedback schemes to improve performance further, adapting to varying conditions in real-time signal processing scenarios.
In terms of practical relevance, filters are found in everyday electronics, from your smartphone's audio output to large-scale communication systems. Understanding filter design principles is essential for engineers seeking to optimize systems for efficiency, clarity, and reliability. As we delve deeper into the design of Butterworth filters, we will build upon this foundational understanding of filtering concepts.
This equation represents the transfer function of a Butterworth filter, where \( H(j\omega) \) is the complex frequency response, \( \omega_c \) is the cutoff frequency, and \( n \) is the order of the filter, which determines the steepness of the filter's roll-off. The maximally flat response feature of Butterworth filters makes them particularly attractive for practical applications where phase distortion must be minimized.
As we proceed through the subsequent sections, we will explore detailed design methodologies for implementing Butterworth filters, including analog and digital approaches, as well as the considerations that affect their performance in real-world scenarios.
1.2 Types of Filters
In the realm of signal processing and communications, filters play a pivotal role in shaping the characteristics of signals. Understanding different types of filters is essential for advanced design and application, particularly in contexts where Butterworth filters are extensively utilized. Filters can be broadly categorized based on their frequency response, which defines how they influence signals at different frequencies. This sub-section will explore the key types of filters: low-pass, high-pass, band-pass, and band-stop filters, emphasizing their construction, mathematical representation, and practical applications.Low-Pass Filters
Low-pass filters (LPF) are designed to allow signals with frequencies below a certain cutoff frequency to pass through while attenuating frequencies above this threshold. Mathematically, an ideal low-pass filter can be characterized by its transfer function, which is given by:High-Pass Filters
Conversely, high-pass filters (HPF) permit signals with frequencies above a defined cutoff frequency while suppressing those below. The transfer function for a typical high-pass filter can be expressed as:Band-Pass Filters
Band-pass filters (BPF) are more complex as they allow a range of frequencies to pass while rejecting frequencies outside this band. They can be envisioned as a combination of low-pass and high-pass filters. The transfer function typically has the form:Band-Stop Filters
Also known as notch filters, band-stop filters (BSF) are designed to suppress a specific range of frequencies while allowing all others to pass. The transfer function for a band-stop filter is given by:Conclusion
Having reviewed these fundamental filter types, it becomes clear that each offers unique advantages based on the required signal manipulation. Whether in audio engineering or telecommunications, the design and implementation of Butterworth filters and similar types serve to enhance signal clarity and fidelity in various applications. In the upcoming sections, we will delve deeper into specific design principles related to Butterworth filters and their distinct advantages when compared to other filter designs. The choice of filter type depends on the specific requirements of the application and desired signal characteristics, paving the way for innovative engineering solutions.1.3 Importance of Filter Design
In the realm of electronics and signal processing, the design of filters plays a critical role in achieving desired system performance. Filters are not merely passive components; they are foundational elements that influence the quality, integrity, and functionality of electronic devices. The choice of filter design, particularly the Butterworth filter, profoundly affects variables such as signal clarity, noise management, and overall system stability.
Understanding Filter Characteristics
The Butterworth filter is renowned for its maximally flat frequency response, making it highly useful in applications where a smooth passband is essential. Unlike other filter types, the Butterworth exhibits no ripples in its passband, allowing it to maintain amplitude levels across the frequencies of interest. This characteristic is vital in audio processing, where preserving the quality of sound signals is paramount. For instance, in high-fidelity sound systems or professional audio equipment, any distortion introduced by the filtering process can lead to a significant loss in sound quality. Therefore, selecting a Butterworth design ensures that audio fidelity is respected.
Applications Across Industries
From telecommunications to medical devices, the principles of filter design extend into numerous fields. For telecommunications, filtering out noise while preserving signal strength is crucial for clear communication. Butterworth filters fit this requirement, offering effective solutions for signal demodulation and data transmission. In medical instrumentation, such as ECG devices, filters aid in isolating the heart signal from environmental noise, facilitating accurate diagnostic interpretations.
Advanced Considerations
While the Butterworth design is advantageous for many applications, engineers must also consider its limitations. Its phase response can lead to group delay variations, which may affect the timing of signals, particularly in data communication and real-time systems. Hence, while pursuing a Butterworth filter design, one must balance between the desired frequency response characteristics and the potential implications on phase response.
The design process also involves trade-offs between filter order and performance. The order of the filter determines the steepness of the cutoff slope; thus, optimizing filter order must be performed with a clear understanding of the operational context. For example, a higher order might provide a sharper roll-off but increase cost and complexity in implementation.
Ultimately, the importance of filter design, particularly that of the Butterworth type, cannot be overstated. As technological advancements continue to push the boundaries of electronics, mastering filter design principles will empower engineers and researchers to create systems that are both innovative and reliable. Continual learning and application of these principles will keep pace with the evolving landscape of modern electronics.
2. Ideal Butterworth Filter Response
2.1 Ideal Butterworth Filter Response
The study of filter design is paramount in signal processing, particularly when it comes to managing the frequency behavior of electronic systems. Among various filter types, the Butterworth filter is heralded for its maximally flat frequency response in the passband, which is especially beneficial for applications demanding minimal signal distortion. This section delves into the ideal Butterworth filter response, looking at its theoretical underpinnings and practical implications.
To gain a clear understanding of the Butterworth filter, we start by defining its transfer function. The ideal Butterworth filter is characterized by its smooth frequency response, where the transition from passband to stopband is accomplished without ripples. The transfer function for an n-th order Butterworth filter is given by:
Here, s represents the complex frequency variable, ωc is the cutoff frequency, and n is the order of the filter. The term (s/ωc) allows us to scale the frequency response of the filter to our desired cutoff frequency.
As we consider the frequency response, it's essential to analyze how this transfer function translates into behavior across different frequency ranges. For ω < ωc, the Butterworth filter exhibits a near-unity gain, indicating that signals within this range are transmitted effectively. Conversely, for ω > ωc, the gain decreases, ultimately approaching zero at higher frequencies, which assures that unwanted high-frequency noise is attenuated. This behavior aligns seamlessly with the requirements in areas such as audio processing and data communications where preserving the integrity of the desired signal is crucial.
The graphical representation of the Butterworth filter response can be visualized with a smooth curve that transitions from a flat passband to a gradual roll-off in the stopband. The steepness of this roll-off is dictated by the order of the filter: a higher order results in a steeper descent, thus allowing for a quicker attenuation of undesired frequencies. An illustration of this ideal frequency response is typically presented in Bode magnitude plots, where the x-axis represents frequency (logarithmic scale) and the y-axis signifies gain (usually in decibels).
Such a visual representation underscores not just the theoretical aspects of the filter, but also its utility in real-world applications. For instance, in audio equipment design, engineers leverage Butterworth filters to ensure crisp sound clarity by efficiently removing frequencies that might distort the audio signal. Moreover, in communications systems, these filters play a vital role in ensuring a clean signal is transmitted while suppressing noise, thus enhancing the overall performance of the system.
The understanding of Butterworth filters extends beyond the mere mathematics; it encapsulates a significant aspect of electronic circuit design, permitting engineers to refine signal integrity and optimize system performance. As you delve deeper into filter design, the concepts surrounding the Butterworth filter's ideal response will form a foundational pillar upon which many advanced filtering techniques are built.
2.2 Frequency Response Characteristics
In the design of Butterworth filters, understanding the frequency response characteristics is crucial for various applications, whether it be in audio processing, data communications, or analog signal processing. A Butterworth filter is specifically designed to have a maximally flat frequency response in the passband, which sets it apart from other types of filters like Chebyshev or elliptic filters, both of which may introduce ripples.Understanding Frequency Response
The frequency response of a filter represents how the amplitude and phase of an output signal varies with frequency. For Butterworth filters, this response is characterized by a smooth transition from the passband to the stopband. The transfer function \(H(s)\) of a Butterworth filter can be derived using its conceptual foundations, where \(s\) represents the complex frequency domain variable. The \(n^{\text{th}}\) order Butterworth filter transfer function takes the form:Magnitude and Phase Response
The magnitude response of the Butterworth filter reveals that the output signal's amplitude decreases smoothly as the frequency moves beyond the cutoff frequency \(\omega_c\). The slope of the roll-off is approximately \(20n \, \text{dB/decade}\), which reinforces the filter's ability to separate signals effectively. When evaluating the phase response, it can be observed that the phase shift increases as frequencies diverge from the cutoff frequency. The relationship between frequency and phase can be complex, and it’s essential to consider it when designing filters for precise applications like communication systems where timing is critical.Practical Applications
The characteristics of Butterworth filters make them particularly advantageous in scenarios where a flat frequency response is paramount. Common applications include:- Audio Processing: Ensuring clarity in sound reproduction without unwanted frequency distortion.
- Control Systems: Used in feedback systems to stabilize control signals without inducing oscillations.
- Data Communication: Digital filtering in modems and routers ensuring that signal clarity is maintained over distances.
2.3 Comparison with Other Filter Types
When discussing filter design within the realm of signal processing, it becomes pivotal to delineate the Butterworth filter's characteristics in relation to other prevalent filter types. A comprehensive understanding of this comparison not only reinforces the applicability of Butterworth filters but also underscores their unique advantages and limitations in various applications.Butterworth Filter Characteristics
The Butterworth filter is celebrated for its flat frequency response in the passband, which makes it particularly appealing for designs where phase distortion must be minimized. Its mathematical representation, characterized by a maximally flat magnitude response, is defined by the transfer function:Comparison with Chebyshev Filters
In contrast to the Butterworth design, Chebyshev filters exhibit a ripple in the passband, allowing for a steeper roll-off between passband and stopband frequencies. This is particularly advantageous in applications where a sharper transition between the two bands is essential. The trade-off, however, is the introduction of ripple, which can lead to phase distortion. The Chebyshev filter has its transfer function given by:Bessel Filters: The Phase Response Champion
When phase characteristics take precedence—such as in audio applications where time alignment is critical—Bessel filters come into play. Bessel filters are renowned for their maximally flat group delay, ensuring that all frequency components of a signal are delayed by the same amount of time. The transfer function of a Bessel filter is represented as follows:Elliptic Filters: The Compromise
On the more intricate end of the spectrum lie elliptic filters, which allow for both ripple in the passband and stopband, thereby achieving the steepest transition band available in filter design. These filters, while providing outstanding performance in terms of roll-off, can introduce significant phase distortion, necessitating careful consideration depending on application requirements. The expression for the elliptic filter's transfer function is more complex but can be pivotal in scenarios where performance demands outweigh the need for phase fidelity.Real-World Applications and Trade-offs
Each filter type serves distinct roles depending on the system requirements. The Butterworth filter’s flatness makes it ideal for audio and certain RF applications where minimal distortion is desired. In contrast, the Chebyshev filter finds its niche in telecommunication systems where signal integrity must be maintained across various bandwidths, and Bessel filters may be favored in applications where time-domain response is critical, such as in low-frequency audio circuits. In essence, the choice between these filters is often a balance among various factors, including desired frequency response, linearity, group delay, and application context. Understanding these dynamics is vital in tailoring filter designs to meet specific engineering challenges efficiently.Conclusion
In the comparative landscape of filter design, the Butterworth filter stands out for its simplicity and effectiveness in maintaining flatness in the passband. However, engineers must take a multidimensional view in their designs, assessing the particular needs of applications to leverage the strengths of other filters, be it the sharp roll-off of Chebyshev, the phase characteristics of Bessel, or the uncompromising performance of elliptic filters. Each type can coalesce into a cohesive signal processing strategy, propelling innovations in telecommunications, audio engineering, and beyond.3. Design Specifications
3.1 Design Specifications
The design of a Butterworth filter requires careful consideration of various specifications that dictate its performance. The Butterworth filter is renowned for its maximally flat frequency response in the passband, making it a favored choice in many audio and signal processing applications. To ensure that the filter meets these requirements, precise design specifications must be established. These typically include frequency parameters, attenuation rates, and component selection.
Defining Key Parameters
The core design specifications revolve around the *cutoff frequency*, *passband ripple*, and *stopband attenuation*. The cutoff frequency defines the threshold at which the filter begins to attenuate the signal. It is crucial for determining the frequency range that the filter will allow to pass without significant loss. The following are the essential parameters:
- Cutoff Frequency (ωc): This frequency is where the output power drops to half its passband level, which corresponds to a –3 dB point in magnitude.
- Passband Ripple (Rp): For a Butterworth filter, minimal ripple is typically desired, which translates to maintaining a flat response within the passband.
- Stopband Attenuation (As): This specification defines how much the filter attenuates signals in the stopband, crucial for eliminating unwanted frequencies.
Standard Specifications for Butterworth Filters
Standard specifications for Butterworth filters may dictate the floor for the passband and stopband. Engineers often utilize the following guideline conventions for a second-order Butterworth filter:
- Cutoff at 1 kHz
- Passband ripple of up to 1 dB
- Stopband attenuation of 20 dB at 1.5 kHz
These standard metrics are instrumental in specific applications such as audio electronics and communication devices, where precise frequency management is essential for optimal performance.
Mathematical Design Derivation
To design a Butterworth filter mathematically, one must first determine the required filter order (n) based on the specified parameters. The relationship is derived from the following equation, which describes the transfer function of a Butterworth filter:
Here, s denotes the complex frequency variable, and θc is the cutoff frequency. The order of the filter can be determined by the expression:
In this equation, As and Ap represent the desired stopband and passband attenuation levels, while f_s and f_c are the stopband and cutoff frequencies respectively. By calculating the appropriate filter order, one can then proceed to select the component values that meet these specifications, ultimately using standardized component values to achieve a specific filter response.
Practical Implementation Considerations
When implementing a Butterworth filter, one must consider factors such as component tolerances, temperature coefficients, and real-world non-idealities that can affect performance. For instance, capacitors' dielectric losses can introduce additional attenuation, thus slightly altering the filter's characteristics from the ideal design. Therefore, simulation software is often employed to refine the design before physical realization.
Considering the growing use of digital signal processing, hybrid techniques that combine analog designs with digital control are also becoming prevalent, allowing for programmable filters that can adapt to various specifications dynamically. These developments highlight the relevance of understanding Butterworth filter design for both analog and digital systems, underscoring its significance in modern electronics.
3.2 Transfer Function Derivation
In the design of analog filters, the transfer function serves as a crucial mathematical representation that describes how the filter modifies the amplitude and phase of input signals based on frequency. Specifically, the Butterworth filter is renowned for its maximally flat frequency response in the passband, which makes it an ideal choice for applications requiring minimal signal distortion. To derive the transfer function for a Butterworth filter, we begin by examining its standard characteristics. A Butterworth filter is defined by its order, denoted as \( n \), which determines the steepness of the filter's frequency response transition from the passband to the stopband. The transfer function \( H(s) \) is expressed in terms of the Laplace variable \( s \) as: $$ H(s) = \frac{K}{s^n + a_{n-1}s^{n-1} + a_{n-2}s^{n-2} + \ldots + a_1 s + a_0} $$ where \( K \) is the gain factor, and \( a_k \) are coefficients determined by the filter's order. ### Step 1: Defining the Butterworth Polynomial The poles of the Butterworth filter, which critically influence its performance, are located at equal angles on the left half of the s-plane. For a Butterworth filter of order \( n \), the poles are: $$ s_k = j\omega_c e^{j(\frac{(2k + 1)\pi}{2n})}, \quad k = 0, 1, 2, \ldots, n-1 $$ where \( \omega_c \) is the cutoff frequency. These poles are symmetrically placed around the imaginary axis, ensuring that the filter is stable. We can express the polynomial in the denominator as: $$ D(s) = (s - s_1)(s - s_2) \ldots (s - s_n) $$ ### Step 2: Expanding the Polynomial It is important to keep in mind that the magnitude response of the Butterworth filter is defined as being constant within the passband. This leads to the following expression for the transfer function: $$ H(s) = \frac{1}{1 + (s/\omega_c)^{2n}} $$ To derive this, we apply the following transformation and properties of the cyclotomic polynomial, which aids in the simplification of the expression: $$ H(s) = \frac{1}{D(s)} $$ ### Step 3: Finalizing the Expression By substituting \( s = j\omega \) and simplifying, we arrive at the finalized state of the transfer function for the Butterworth filter:3.3 Normalization of Filters
Introduction to Filter Normalization
Filter design, particularly for analog systems such as Butterworth filters, often necessitates normalization to ensure the parameters are consistently expressed for analysis and implementation. The aim of normalization is to simplify the design process while maintaining the desired filter characteristics, notably the cut-off frequency and passband behavior. Normalization processes facilitate the transformation of analog filter prototype specifications into more practical configurations suitable for real-world applications. This section will delve into the details of the normalization of Butterworth filters, emphasizing why and how this approach is applied.Understanding the Butterworth Filter
The Butterworth filter is renowned for its flat frequency response within the passband, providing an optimal trade-off between ripple in the passband and attenuation in the stopband. The normalized Butterworth filter specifically has a maximally flat magnitude response, making it an excellent choice for many applications where phase distortion must be minimized. The normalized transfer function of an n-th order Butterworth filter is given by: $$ H(s) = \frac{1}{1 + \left( \frac{s}{\omega_c} \right)^{2n}} $$ where \( \omega_c \) is the normalized cut-off frequency, typically set to 1 rad/s in normalization, while \( s \) denotes the complex frequency variable.The Normalization Process
The process of normalization entails adjusting the filter's specifications so that the critical frequency aligns with a unit frequency, streamlining analysis and synthesis. The steps typically include: 1. Define the Cut-off Frequency: Determine the desired cut-off frequency, \( f_c \), which represents the -3 dB point in the frequency response. This frequency is central to establishing filter performance. 2. Transform the Transfer Function: Adjust the transfer function of the prototype by substituting \( s \) with \( s = j\omega \) in the general form of the Butterworth filter. This substitution allows the filter to operate over a normalized frequency scale. 3. Scalability Adjustment: Implement a scaling factor for the transfer function, which relates the normalized frequency to the actual application frequency. This often involves multiplying the normalized transfer function by \( \frac{1}{\omega_c} \). 4. Parameter Visualization: Construct the Bode plot or frequency response graph of the normalized transfer function to visually demonstrate its behavior and ensure that all key characteristics, such as the cut-off frequency and roll-off rate, are in alignment with design specifications.Practical Applications
Normalization facilitates efficient analysis and simulation, notably in environments where rapid design iterations are necessary. Industries such as telecommunications leverage normalized Butterworth filters for their simplicity and predictable response patterns. Moreover, the design of digital filters, audio processing filters, and signal conditioning circuits often starts with a normalized Butterworth filter before adaptation to specific application contexts.Given the importance of these filters in various applications, consolidating their foundational designs through normalization significantly streamlines the design process, allowing engineers to focus on optimization and customization for specific needs.
Conclusion
The normalization of Butterworth filters is a crucial step in filter design, ensuring that the resultant filter meets the required specifications with ease. By understanding the principles of normalization, engineers and researchers can efficiently devise solutions that harness the desirable qualities of Butterworth filter responses while adapting to practical constraints and applications. Whether in analog or digital domains, incorporating normalization into filter design is a vital practice for achieving effective and reliable performance.3.4 Component Selection and Sizing
In designing a Butterworth filter, the selection and sizing of components are pivotal for achieving the desired frequency response, as this directly influences the filter's performance and efficiency. The Butterworth filter is characterized by its maximally flat frequency response in the passband, which necessitates careful consideration during component selection to maintain this flat profile while minimizing signal distortion.
Understanding Component Types
Commonly used components in Butterworth filter design include resistors, capacitors, and inductors. The role of each component is critical:
- Resistors: They regulate the current flow and help in defining the filter's cutoff frequency.
- Capacitors: They store and release energy, significantly affecting the phase response and frequency behavior.
- Inductors: Inductors store energy in a magnetic field, impacting lower frequency operations more profoundly.
In active filter designs, operational amplifiers (op-amps) are also crucial, providing necessary gain and buffering to prevent loading effects that could distort the filter response.
Calculating Sizing Parameters
The sizing of components is typically dictated by the desired cutoff frequency \((f_c)\) and the filter order \(n\). The Butterworth filter design can be described mathematically using the normalization constant \( \omega_c = 2\pi f_c \). The cutoff frequency must align with the selected components' real-world values, and practical designs often use the following relationships:
where \(R\) is the resistance and \(C\) is the capacitance. For a low-pass Butterworth filter, you would adjust \(R\) and \(C\) values in accordance with your frequency response requirements.
Using Standard Component Values
Due to the availability of standardized component values, it is often practical to consult E12 or E24 series resistor and capacitor values to select appropriate components. One common approach to component selection involves:
- Determining the desired cutoff frequency.
- Using the formula above to calculate the theoretical \(R\) and \(C\).
- Rounding to the nearest standard value in the series.
- Simulating the filter to confirm performance before final selection.
Inductor Sizing Considerations
In inductive designs, the value of the inductor affects the quality factor \(Q\) of the circuit, which is essential for tuning the filter's response. The inductor's size and physical properties also affect the overall size and layout of the circuit, especially in RF applications. High-frequency designs often prioritize induction types that minimize parasitic capacitance, such as air-core inductors.
Practical Considerations
When selecting these components, one must also consider practical factors such as:
- Tolerances: Each component will have a tolerance that affects the overall response; tighter tolerances lead to more predictable performance.
- Temperature Coefficients: The stability of the component values across varying temperatures can impact circuit performance, especially in precision applications.
- Power Ratings: Ensure that components can handle the power levels in the application without damage.
In conclusion, component selection and sizing in Butterworth filter design is a nuanced process that requires a deep understanding of the theoretical underpinnings, mathematical relationships, and practical considerations. The success of the design hinges on balancing these factors to meet the specifications of a given application.
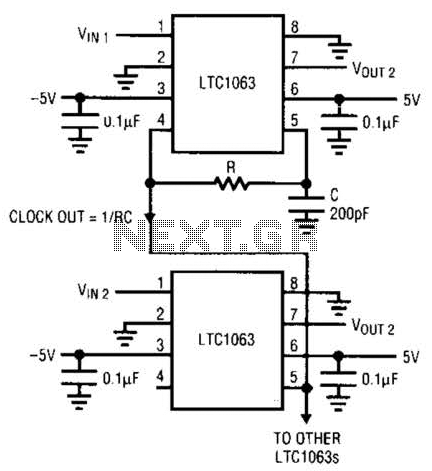
4. Passive Butterworth Filter Circuits
4.1 Passive Butterworth Filter Circuits
Passive Butterworth filters are renowned for their maximally flat frequency response in the passband, a key characteristic that makes them widely used in various electronic applications, from audio processing to RF communication systems. These filters, composed solely of passive components such as resistors, capacitors, and inductors, effectively eliminate unwanted signals without the need for external power sources. This section delves into the design principles, circuit configurations, and practical considerations of constructing passive Butterworth filters.
Understanding the Butterworth Response
The Butterworth filter is particularly noted for its smooth, flat frequency response in the passband. Unlike other filter types, such as Chebyshev or Bessel filters, the Butterworth design avoids ripples in the passband, resulting in minimal distortion of signals. The magnitude response of a Butterworth filter can be described using the following transfer function:
In this equation, \( n \) is the filter order, \( s \) is the complex frequency variable, and \( \omega_c \) is the cutoff frequency at which the filter begins to attenuate signals. The higher the order of the filter, the steeper the roll-off beyond the cutoff frequency.
Designing a First-Order Butterworth Filter
For practical implementation, we begin with the simplest case: a first-order passive Butterworth filter. A first-order filter consists of a single reactive component paired with a resistor, providing a gradual roll-off of -20 dB/decade. The basic configuration for a low-pass first-order Butterworth filter can be visualized with a resistor \( R \) and capacitor \( C \) in series, where the output is taken across the capacitor.
The design equations governing this configuration are derived based on impedance and voltage division. The cutoff frequency, defined as the frequency where the output voltage is reduced to 70.7% of the input voltage, is given by:
Thus, for a desired cutoff frequency, the values of \( R \) and \( C \) can be selected. Additionally, component tolerances and their respective influence on performance must be considered to ensure the desired response is achieved.
Higher-Order Butterworth Filters
To achieve a steeper roll-off, higher-order Butterworth filters can be constructed using cascaded first-order sections or by employing second-order configurations using additional reactive components. A second-order passive low-pass Butterworth filter can be implemented with a resistor \( R_1 \), and capacitors \( C_1 \) and \( C_2 \), arranged such that the output voltage is taken across \( C_2 \). The resulting transfer function becomes more complex, but it maintains the Butterworth characteristics of a flat passband with a more rapid attenuation curve.
Ultimately, the design of passive Butterworth filters presents numerous practical applications in real-world electronics. Their ease of design and implementation makes them a staple in audio systems where signal integrity is critical, and in RF applications where filtering out bandwidth-specific signals is essential for clarity and performance.
Practical Considerations
In practical implementations, one must consider component non-idealities such as tolerance variations and the potential impact of parasitic elements associated with the components. Moreover, simulation software like SPICE can be very useful for analyzing filter performance before physical construction.
In conclusion, passive Butterworth filters serve as foundational elements in electronic circuit design, offering a blend of simplicity, effectiveness, and reliability. Explorations into their behavior and performance continue to be of interest as technology advances and applications evolve.
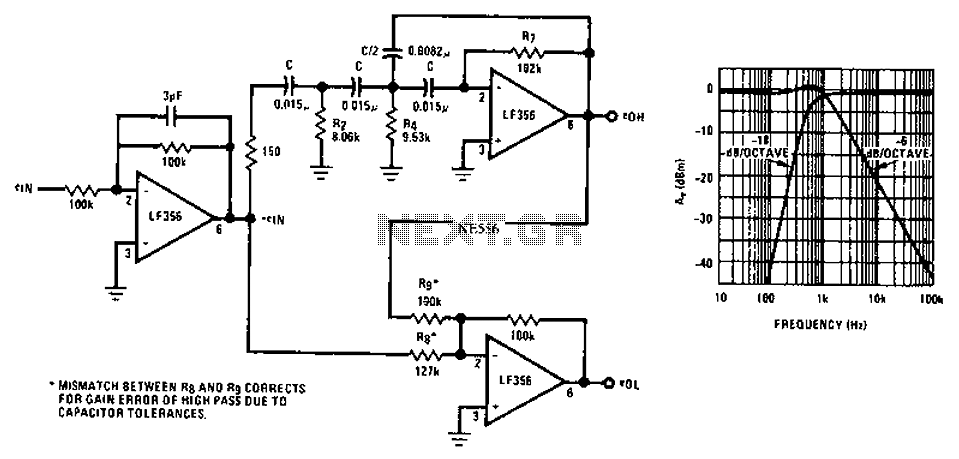
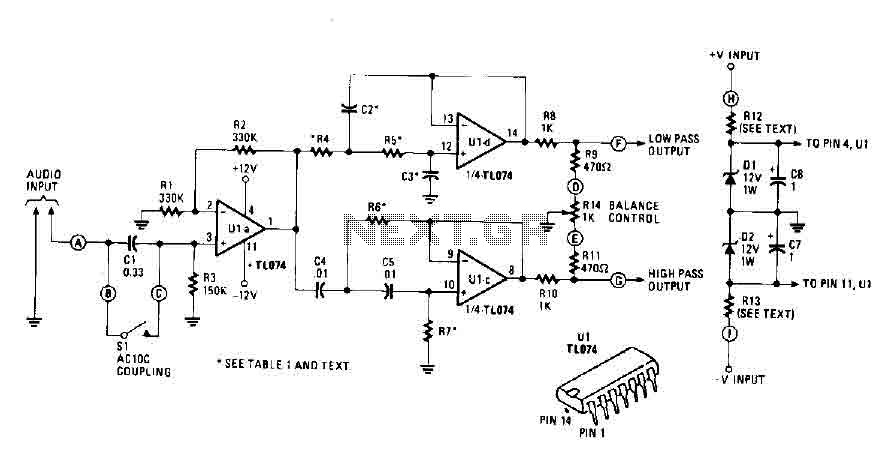
Active Butterworth Filter Circuits
The Butterworth filter, renowned for its maximally flat frequency response in the passband, is not only limited to passive components. In modern electronic circuit design, active Butterworth filters leverage operational amplifiers (op-amps) to enhance filter performance. This subsection delves into the design considerations, circuit architectures, and practical implementations of active Butterworth filters.
Defining Active Filters
Active filters differ from their passive counterparts by incorporating active components such as op-amps, which not only provide gain but also introduce higher input and lower output impedances. This combination allows for better performance characteristics in terms of stability, tuning capabilities, and frequency response. Active filters can achieve higher-order responses without the physical constraints of passive components, making them particularly advantageous in audio and RF applications.
Basic Configuration
A typical active Butterworth filter can be realized using various configurations. The most common are:
- Low-Pass Filters (LPF) - These filters allow signals below a certain cutoff frequency to pass while attenuating higher frequencies.
- High-Pass Filters (HPF) - Opposite to LPFs, these filters allow signals above the cutoff frequency to pass and attenuate lower frequencies.
The second-order Butterworth filter can be achieved by cascading two first-order sections, which can be implemented using either Sallen-Key or multiple feedback configurations. The Sallen-Key topology is particularly popular due to its simplicity and ease of adjustment.
Designing a Second-Order Active Butterworth Filter
For a second-order low-pass Butterworth filter, we can start by calculating the desired cutoff frequency, fc, given by:
In this equation, R is the resistance and C is the capacitance used in the circuit. To achieve a Butterworth response, the circuit needs to be configured such that the poles of the filter are uniformly distributed on a semicircle in the left half of the s-plane.
For our example, let's select component values to target a cutoff frequency of 1 kHz. Choosing R as 15 kΩ and solving for C, we find:
With the components selected, we can construct the Sallen-Key configuration using operational amplifiers. This configuration utilizes two resistors and two capacitors and provides a broad passband with excellent phase characteristics.
Real-World Applications
Active Butterworth filters are prevalent in various applications, including:
- Audio Processing: Ensuring clear sound quality in mix and mastering equipment.
- Signal Conditioning: Preparing sensor signals for further digital processing by eliminating noise.
- Communication Systems: Filtering unwanted frequencies from modulated signals to enhance fidelity.
To conclude, the design of active Butterworth filters combines theoretical understanding with practical circuit implementation skills, providing engineers and researchers with versatile tools for a range of applications. By carefully selecting components and configurations, one can leverage the characteristics of active filters to achieve desired signal processing outcomes.
4.3 Real-world Applications and Examples
The Butterworth filter, known for its maximally flat frequency response in the passband, finds utility across a diverse range of engineering fields. Its unique characteristics make it an ideal choice for various real-world applications that require precise signal processing. In this section, we will explore some practical applications where Butterworth filters are employed, illustrating their significance in both theoretical and applied contexts.
Telecommunications
In telecommunications, maintaining signal integrity is paramount. Butterworth filters are commonly used to eliminate unwanted spectral components from signals before they are transmitted. For instance, they are deployed in modulation schemes to shape transmitted signals and reduce intersymbol interference, which is essential for improving data rates and reliability in modern wireless communication systems, such as LTE and 5G.
Audio Processing
In audio applications, Butterworth filters serve as essential tools in equalization and crossover networks. By ensuring a smooth transition between frequency bands, they enable the effective separation of audio channels. For example, low-pass Butterworth filters can be used to restrict higher frequencies in a subwoofer to preserve sound quality while minimizing distortion.
Control Systems
In control systems, especially in signal conditioning, Butterworth filters are employed to remove high-frequency noise from sensor signals. This is critical in applications such as robotics or process control, where accurate feedback is required to ensure stability and performance. Here, the filter facilitates a clear representation of the system's behavior by providing a clean signal.
Precision Measurement Instruments
Butterworth filters are also significant in precision measurement instruments, such as oscilloscopes and spectrum analyzers. These instruments utilize Butterworth filtering techniques to optimize their signal capture and analysis capabilities. By attenuating out-of-band noise, these filters ensure that only relevant frequencies are measured, improving measurement accuracy and reliability.
Case Study: Audio Systems
To illustrate the practical application of Butterworth filters, consider a case study in high-fidelity audio systems. Engineers often implement second-order Butterworth low-pass filters in speaker crossover designs. This ensures a balanced distribution of audio frequencies to different drivers—in this case, woofers and tweeters—resulting in improved audio clarity and overall system performance.
Conclusion
The versatility of Butterworth filters allows them to be adapted to various applications across different fields. By providing a combination of effective frequency response and simple design, these filters prove to be invaluable in real-world engineering challenges.
5. Overview of Simulation Software
5.1 Overview of Simulation Software
In the realm of electronic filter design, simulation software serves as a critical tool that bridges theoretical concepts and practical implementation. A Butterworth filter, known for its maximally flat frequency response in the passband, can be effectively designed and analyzed using various software platforms. The ability to simulate these filters enables engineers to visualize performance, tweak parameters, and optimize designs before physical prototypes are constructed.
Simulation software typically allows users to explore various filter designs and configurations through mathematical modeling. This includes defining pole locations in the s-plane, characterization of transfer functions, and exploring the effects of component tolerances on filter performance. Moreover, users can simulate circuit behavior over a range of frequencies, providing insights into the filter’s response characteristics.
Types of Simulation Software
The design and analysis of Butterworth filters can be carried out using various software tools. Below are some of the most commonly used platforms:
- SPICE (Simulation Program with Integrated Circuit Emphasis): A widely adopted tool for simulating analog circuits, SPICE allows for detailed examination of circuit behavior. Its capabilities include transient analysis, frequency response, and noise analysis, making it essential for filter design. Variants such as LTspice and PSpice extend functionality with graphical interfaces and additional features.
- MATLAB/Simulink: These platforms are known for their powerful computational capabilities and user-friendly graphical interface. MATLAB provides extensive built-in functions for filter design, such as butter for constructing Butterworth filters, along with the bode function for frequency response analysis. Simulink allows for real-time simulation of filters within dynamic systems.
- Tools like NI Multisim: Which combines circuit simulation, PCB design, and analysis in one platform. Multisim comes equipped with a variety of components and allows easy integration of Butterworth filters into larger systems while visualizing their performance.
Practical Applications and Importance
Simulation tools not only facilitate filter design but also allow engineers to explore various parameters such as component values, filter order, and overall circuit stability. This ensures that the resulting physical design meets the required specifications without the extensive trial-and-error that would be necessary in a purely experimental approach. Furthermore, the results from simulations can directly inform component selection and circuit layout strategies in real-world applications, such as audio processing, telecommunications, and signal conditioning.
As technologies advance, the implementation of simulation software continues to evolve, leading to more sophisticated functionalities including optimization algorithms and machine learning approaches for more efficient design processes. Thus, engineers equipped with simulation software can ensure that their Butterworth filters and other electronic components perform optimally in their intended applications.
5.2 Schematic Design and Simulation
In the realm of electronic filter design, the schematic design serves as a pivotal step for implementing Butterworth filters. This design phase transforms theoretical specifications into practical circuits, allowing for simulation and testing prior to physical fabrication. By understanding the schematic and utilizing simulation tools, engineers and researchers can refine their designs efficiently.Understanding Schematic Design
The schematic of a Butterworth filter typically comprises operational amplifiers (op-amps), resistors, and capacitors configured in a manner that meets the desired frequency response while adhering to the Butterworth characteristic of maximally flat passband behavior. The complexity of the schematic is dictated by the filter order: an n-th order Butterworth filter will have n—1 reactive components, yielding an enhanced roll-off rate and a more accurate approximation of the ideal filter behavior. To visualize the Butterworth filter schematic, consider a second-order active low-pass filter as a starting point. The basic configuration includes two integrators implemented using op-amps, connected in cascade. This setup can be represented as follows: 1. First stage: The input signal is fed into the first op-amp configured as an integrator, connected to a feedback capacitor and resistor, creating a cut-off frequency defined by the values of these components. 2. Second stage: The output of the first op-amp is then fed to the second op-amp set up similarly to integrate and further process the signal. An illustration depicting this design is beneficial for understanding the interconnections and functional layout.Simulation Tools and Their Role
After drafting the schematic, simulation tools such as SPICE (Simulation Program with Integrated Circuit Emphasis) can be employed for analysis. These tools allow users to preview the filter's response under various conditions, ensuring that the implementation follows the desired frequency characteristics closely. To perform the simulation: 1. Input the schematic: Enter the components and their configurations into the simulation software. 2. Set parameters: Define the resistor and capacitor values that establish the cut-off frequency. For a Butterworth filter, the choice of these values is critical as they determine the filter's performance. 3. Run a frequency response analysis: Generate Bode plots to visualize phase and gain across a range of frequencies, confirming that the filter meets the expected Butterworth flatness in the passband and appropriate roll-off.Example of Component Value Calculation
To illustrate how to determine the component values for achieving a specific cut-off frequency, let’s consider a second-order Butterworth filter with a desired cut-off frequency \( f_c \). The cut-off frequency for an active low-pass filter can be derived from the following formula: $$ f_c = \frac{1}{2 \pi R C} $$ In this equation, \( R \) represents the resistance and \( C \) the capacitance in the first stage of the filter. By manipulating the equation, engineers can select suitable \( R \) and \( C \) values to achieve \( f_c \). For example, if a cut-off frequency of 1 kHz is desired, one might choose \( R = 1 k\Omega \) and solve for \( C \): $$ C = \frac{1}{2 \pi (1000)(1000)} \approx 159.15 \, nF $$ By iteratively testing different values for \( R \) and \( C \), as well as simulating the filter response, optimal component selections can be determined.Practical Applications
Butterworth filters find extensive use in audio processing, telecommunications, and instrumentation systems, where preserving signal integrity is paramount. The ability to achieve linear phase characteristics in the passband, along with minimal ripple, makes these filters particularly valuable in high-fidelity audio systems to eliminate unwanted frequencies without degrading the desired signal. In conclusion, mastering the schematic design and simulation of Butterworth filters enhances an engineer's capability to engineer reliable and high-performance electronic systems. The transition from a theoretical concept to a practical design through simulation not only saves time and resources but also paves the way for innovative applications across various fields.5.3 Experimental Validation Techniques
In the journey of designing a Butterworth filter, the theoretical framework serves as a vital foundation, yet experimental validation ensures that the designed filter performs as expected in real-world scenarios. This section delves into the techniques used to validate the performance of Butterworth filters, emphasizing the significance of experimenting under controlled conditions to evaluate critical parameters such as frequency response, attenuation, and phase characteristics.Understanding Butterworth Filter Characteristics
Before undertaking experimental validation, it is essential to comprehend the key characteristics of a Butterworth filter. Defined by its maximally flat frequency response in the passband, the Butterworth filter is characterized by a smooth transition between the pass and stop bands. The -3 dB cutoff frequency, at which the output power drops to half its maximum value, is of particular importance. To adequately validate its performance, various experimental techniques can be employed, each targeting specific characteristics of the filter. These validation techniques encompass hardware setups, signal measurements, and analysis methods.Hardware Setup for Experimental Validation
When designing the experimental setup, engineers often employ various components such as operational amplifiers, resistors, capacitors, and precise test equipment to construct the Butterworth filter. The architectural integrity of this setup is critical; thus, utilizing a breadboard for prototyping allows for easy modifications and adjustments during testing. To ensure accurate measurements, the following instruments are typically utilized:- Function Generator: This device generates test signals at various frequencies to evaluate the filter's response.
- Oscilloscope: Employed for visualizing the input and output waveforms, enabling real-time analysis of the filter response.
- Multimeter: Used in measuring resistance, capacitance, and signal voltages to ensure proper component functionality.
Signal Measurement and Evaluation Techniques
Once the experimental setup is complete, the focus shifts to measuring and analyzing signal characteristics. The primary steps in this evaluation include: 1. Frequency Response Testing: By gradually varying the frequency from below the cutoff frequency to above the stop band, the gain at each frequency point can be measured. This data can be plotted to create a frequency response curve, highlighting the gain's behavior as the frequency changes. 2. Attenuation Measurements: It involves measuring the output level in relation to the input level across different frequencies. The difference in dB indicates how well the filter attenuates unwanted signals, especially those frequencies in the stop band. 3. Phase Shift Analysis: Determining the phase shift between the input and output signals is crucial for assessing the filter's behavior. The phase response curve can be derived by extracting the phase angle of the output signal relative to the input at various frequencies. To visualize the relationship between output gain and frequency, a Bode plot can be constructed. This graph comprises two separate plots: one for gain (in dB) and the other for phase shift (in degrees), both plotted against the logarithm of frequency.Visualizing the Frequency Response
Consider a Bode plot where the x-axis represents the logarithm of frequency and the y-axis shows gain in dB on the upper plot, while the lower plot depicts phase shift in degrees. The resulting curves should illustrate the Butterworth filter's characteristic features: a smooth transition in the passband and a steep roll-off past the cutoff frequency.Confirming Theoretical Predictions with Data Analysis
After acquiring the data, it can then be compared against theoretical predictions derived from the Butterworth filter equations. The attenuation and phase shift can be mathematically modeled by the transfer function, defined for an nth-order Butterworth filter as:6. Common Design Issues
6.1 Common Design Issues
In the realm of Butterworth filter design, several common issues arise that can impede the effectiveness of the filter's performance. Understanding these challenges is paramount for advanced engineers and researchers tasked with filter implementation in real-world applications. This section explores several critical design issues, ranging from component selection to stability and implementation intricacies.Component Tolerances
One significant issue is the precision of components used in the filter. Butterworth filters are often sensitive to variations in component values due to their specific frequency response characteristics. For instance, passive components such as resistors and capacitors can have tolerances that may shift the cutoff frequency or alter the filter's behavior. To mitigate these effects, engineers can adopt precision components with tighter tolerances or use feedback mechanisms in active filters to account for variable component characteristics. These approaches ensure that the filter maintains its intended performance, demonstrating the critical relationship between theoretical design and practical execution.Temperature Dependence
Another concern is temperature dependence. As temperature shifts, the properties of resistors, capacitors, and inductors also change, which can lead to frequency drift in the filter response. This is particularly relevant in applications where the filter operates under fluctuating environmental conditions, such as in automotive or aerospace electronics. To address this issue, designers can employ components with minimal temperature coefficients or implement temperature compensation techniques, thereby maintaining filter stability over a range of operating conditions. Understanding and addressing temperature effects not only enhances reliability but also extends the application range for Butterworth filters.Impedance Matching
Impedance matching is critical for maximizing power transfer and minimizing reflections in signal processing applications. In many cases, mismatches between the filter and adjacent circuit components can lead to signal degradation or distortion. Designers must ensure that the input and output impedances of the Butterworth filter align with those of the interfacing components. Utilizing buffer amplifiers or tuning network resistances can achieve this impedance matching. Engineers should make these adjustments in the design phase to ensure robust performance. Without proper impedance matching, even the most well-designed Butterworth filter may not perform as expected.Stability and Phase Response
Stability is another vital aspect that must be considered throughout the design process. In active filter configurations, the feedback components can introduce instability if not carefully selected. Moreover, the phase response can adversely affect time-domain signals, such as when the filter is used in signal processing or communication applications. To improve stability, designers may deploy techniques such as pole-zero placement or utilize advanced operational amplifier configurations to stabilize the filter's response. Maintaining a flat phase response is equally important for applications like audio processing, where phase distortions can detract significantly from the perceived signal quality.Real-World Applications
Butterworth filters have versatile applications in numerous fields, including telecommunications, audio processing, and biomedical engineering. Engineers must navigate these design challenges diligently to achieve satisfactory results. For instance, in audio applications, a Butterworth low-pass filter might be utilized to eliminate high-frequency noise while maintaining sound integrity, all while ensuring that the aforementioned issues are adequately addressed. By recognizing and rectifying common design issues, engineers and researchers can unlock the full potential of Butterworth filters, enabling them to thrive in demanding applications that require both precision and reliability. Addressing these challenges is not merely about adhering to theoretical concepts but about the practical application of innovative solutions tailored to specific engineering requirements.6.2 Performance Optimization Techniques
The design of Butterworth filters is governed by the need to achieve a maximally flat frequency response in the passband. However, achieving optimal performance can often necessitate advanced strategies beyond the initial design. In this section, we will discuss various techniques aimed at optimizing the performance of Butterworth filters, ensuring they meet stringent application requirements. These techniques involve trade-offs, where a deeper understanding of the underlying principles will enable more informed decisions during the design process.
Understanding Key Parameters
To effectively optimize a Butterworth filter, one must first appreciate the key parameters that influence its performance:
- Order of the Filter: The higher the order, the steeper the roll-off and greater the attenuation in the stopband. However, increasing the order can lead to increased component complexity, higher cost, and more substantial phase distortion.
- Cutoff Frequency: Selecting an appropriate cutoff frequency, where the passband transitions to the stopband, is vital. Misjudgment here may result in inadequate filtering or overly aggressive attenuation of desired signals.
- Component Quality Factors: The quality of components (resistors, capacitors, and operational amplifiers) impacts the performance significantly. Low tolerance and low-temperature coefficient components contribute to a stable frequency response.
1. Trade-offs in Filter Order
While increasing the filter order achieves a steeper response, it may introduce problems such as increased power consumption and signal degradation due to non-ideal component behavior. A balance must be struck based on application requirements. For example, in audio processing applications where phase linearity is critical, designs often limit the filter order to maintain a balanced response.
Choosing the Right Filter Order
Determining the optimal order for a Butterworth filter might involve numerical methods or empirical testing. An iterative approach using tools like MATLAB or SPICE can facilitate optimizing the filter performance by allowing designers to simulate and analyze the frequency response and phase shift characteristics.
2. Utilizing Active Components
Incorporating active components, such as operational amplifiers, can significantly improve the Butterworth filter's performance. Active filters can provide high gain, reduce the impact of component tolerances, and allow for the construction of higher-order filters without the requisite complexity and bulk of passively coupled networks. Typical topologies like active Sallen-Key filters may be employed for this purpose.
Active Filter Design Considerations
Active filters increase design flexibility and can be tuned more easily than passive filters. Nonetheless, considerations around power supply rejection and op-amp bandwidth become significant. Rigorous analysis is necessary to ensure that the op-amps used in the design can adequately handle the signal frequencies without introducing distortion.
3. Q-Factor Optimization
The Q-factor, which defines a filter's selectivity and bandwidth, plays a crucial role in Butterworth filter design. A filter with a low Q-factor will have a broader bandwidth, resulting in less sharp transitions. Conversely, a high-Q filter may lead to peaking in the response, which could compromise performance.
Explore the Q-factor Relationship
The relationship between the Q-factor and performance can be quantified. For a second-order Butterworth filter, the Q-factor can be derived as follows:
In this formula, \(R_1\) and \(R_2\) represent the resistances in the feedback path of the filter circuit. By manipulating these values, one can assess the impact on the filter's performance, ensuring its suitability for the intended application.
4. Temperature Stability and Frequency Drift
Temperature-induced variations can lead to frequency drift, particularly in critical applications like RF signal processing. Choosing components with minimal temperature coefficients and implementing compensation techniques can help maintain performance integrity. Regular calibration and environmental consideration should also be part of the design discharge to counteract these effects.
Implementation of Compensation Techniques
Techniques such as thermistors can be integrated into circuits for automatic regulation of resistance based on temperature changes, thereby mitigating drift effectively. Designers should simulate performance across varied conditions to ensure robustness.
5. Performance Simulation Tools
Utilizing simulation tools like LTspice, Multisim, or MATLAB is invaluable for visualizing the behavior of Butterworth filters under various conditions. Through detailed simulations, engineers can explore the frequency response, transient response, and phase characteristics, which are essential for assessing performance optimally and iterating designs accordingly.
In conclusion, optimizing the performance of Butterworth filters involves a comprehensive understanding of key parameters, adept manipulation of active components, and careful monitoring of environmental effects. The techniques outlined in this section empower engineers and researchers to tailor filter designs effectively, ensuring their performance aligns with application-specific requirements.
6.3 Adjustments for Real-world Conditions
The design of Butterworth filters is often approached through idealized mathematical models. However, real-world applications frequently encounter practical challenges that necessitate modifications to these ideal scenarios. In this section, we will explore common adjustments needed for real-world conditions, including component tolerances, parasitics, temperature variations, and circuit configurations.
Component Tolerances
One of the primary challenges in implementing Butterworth filters is the tolerance of passive components, such as resistors and capacitors. Standard components may have tolerances ranging from ±1% to ±10%, which can significantly impact the filter's performance. This variability can result in deviations from the desired cutoff frequency and affect the overall response.
To mitigate these effects, designers often use components with lower tolerances, or consider tolerancing analysis during the design phase. This involves simulating the filter’s performance across the range of component values to assess the worst-case scenarios. Additionally, incorporating trim potentiometers can allow for manual adjustments after assembly.
Parasitic Elements
In practical circuit layouts, parasitic inductances and capacitances can alter the expected performance of Butterworth filters. For example, the layout of the PCB can introduce unintentional inductance in series with resistors or capacitors, which may shift the cutoff frequency or cause undesired resonances.
A typical approach to address these parasitics includes:
- Simulation Tools: Utilize circuit simulation software (like SPICE) to predict how parasitic effects impact the filter response.
- Careful Layout Design: Implement PCB design strategies to minimize loop areas and keep component leads short, thereby reducing inductance.
Temperature Variation
Component values can vary significantly with temperature changes. For example, capacitors and resistors may drift from their nominal values, leading to alterations in the filter’s frequency response. Therefore, it is essential to consider temperature coefficients of components when selecting parts for critical applications.
To compensate for thermal drift:
- Use Temperature-Stable Components: Employ components rated for low temperature-coefficient, particularly in precision applications.
- Temperature Compensation Methods: Design feedback mechanisms where circuit behavior is adjusted during temperature variations, ensuring consistent performance.
Feedback and Circuit Configuration
While active Butterworth filters benefit from operational amplifiers, their configuration also introduces additional considerations. Feedback unintentionally affects the gain and phase response of the filter, especially if the feedback paths are improperly managed. Additionally, the selection of op-amp can affect bandwidth and slew rate, further complicating performance expectations.
To optimize these configurations:
- Op-amp Selection: Choose op-amps with sufficient bandwidth and slew rate specifications to ensure that the filter operates effectively over its intended frequency range.
- Implement Feedback Topologies: Design feedback paths that maintain stability and minimize the phase shift, preserving the desired Butterworth characteristics.
Conclusion
Implementing Butterworth filters in real-world applications requires a multifaceted approach. Understanding the implications of component tolerances, parasitic elements, temperature variations, and circuit configurations is paramount to achieving reliable filter performance. By carefully considering these factors, engineers and designers can create robust electronic systems that maintain their desired specifications.
7. Key Textbooks on Filter Design
7.1 Key Textbooks on Filter Design
- Digital Signal Processing by John G. Proakis — This textbook offers a comprehensive study of digital signal processing principles, including filter design. It's an essential resource for learning the theoretical underpinnings of signal filters, including Butterworth filters.
- Active Filter Design by Allan Y. Zinn — The book provides a detailed approach to active filter design featuring practical examples and real-world applications. It dedicates sections to various types of filters, including Butterworth, with step-by-step design procedures.
- Digital Filters: Design for Signal Processing Applications by Lizhe Tan — This publication is aimed at signal processing professionals and includes chapters devoted to different filter types, focusing on applicable design techniques for finite impulse response (FIR) and infinite impulse response (IIR) filters.
- Analog and Digital Filter Design by Steve Winder — Winder's book is an all-encompassing guide on the theory and practical design of analog and digital filters, exploring multiple filter types and discussing Butterworth filters with clear practical examples.
- Digital Filter Design by T. W. Parks and C. S. Burrus — As a staple in the field of filter design, this book describes various approaches for digital filter design, including Butterworth filters, and includes exercises for enhancing comprehension of the subject matter.
- Signal Processing and Linear Systems by B. P. Lathi — Providing a broader perspective on signal processing, Lathi's text explains linear system theory and its applications in filter design, with in-depth discussions on Butterworth filters and their properties.
- Analog Filter Design by M.E. Van Valkenburg — Esteemed for its practical approach, this book covers the essentials of analog filter design, elaborating on the design and implementation of Butterworth filters among other filter classes.
7.2 Scholarly Articles and Journals
- Design of Optimal Pole-Zero Filters — This paper from IEEE discusses the mathematical foundations and techniques for designing optimal pole-zero filters, offering insights applicable to Butterworth filter implementations.
- Butterworth and Chebyshev Filters — A comparative study from ScienceDirect on the performance and application of Butterworth and Chebyshev filters, including a detailed analysis of filter order and response characteristics.
- Digital Filter Design Using Butterworth Criteria — SpringerLink provides a comprehensive coverage on using Butterworth design criteria for implementing digital filters, highlighting the stability and frequency response optimization.
- Analog Butterworth Filter Design for Optimal Flatness — This article from Taylor & Francis explores design strategies for achieving optimal flatness in analog Butterworth filters, focusing on parameter variations and robustness.
- Advanced Techniques in Butterworth Filter Design — A study hosted on arXiv that discusses advanced methodologies and computer-aided approaches for the design and implementation of Butterworth filters.
- Historical Overview of Butterworth Filter Development — JSTOR offers an insightful historical review of the evolution and development of Butterworth filters, tracing its inception and technological advancements.
- Real-world Applications of Butterworth Filters — A review of practical applications of Butterworth filters in various engineering fields, as presented in Engineering Village, including communications and control systems.
7.3 Online Resources and Tutorials
As an advanced-level reader looking to deepen your understanding of Butterworth Filter design, utilizing comprehensive and specialized online resources can be invaluable. Below is a curated list of high-quality, topic-relevant external links that provide tutorials, detailed explanations, educational resources, and simulation tools related to Butterworth Filters. These resources can be particularly beneficial in bridging any gaps in theoretical knowledge, offering practical insights, or providing tools for circuit simulations.
- TI's Op Amp Filter Design — A detailed PDF document by Texas Instruments that discusses active filter design including Butterworth filters, covering fundamental theory as well as practical implementation techniques.
- Designing a Butterworth Low-Pass Filter Using Python — A practical guide on implementing a Butterworth low-pass filter using Python, complete with step-by-step instructions and code examples.
- Electronics Tutorials Butterworth Filter Design — An Electronics Tutorials page providing a comprehensive walkthrough of Butterworth filter equations, design principles, and frequency response characteristics.
- Understanding and Designing Butterworth Filters — A detailed article that explains the design process of Butterworth filters, including design specifications, mathematical derivations, and practical applications.
- The Microwave Encyclopedia on Butterworth Filters — Microwave101.com provides an accessible yet technical overview of Butterworth filters and their application in RF engineering and microwave design.
- Analog Devices' Introduction to Filter Design — A tutorial by Analog Devices that delves into the intricacies of various filter designs including Butterworth filters, supported by clear theoretical insights and practical guidance.
- Active Butterworth Filter Design and Performance Analysis — An open-access journal article that evaluates the performance of active Butterworth filters using computer-aided software, offering a scientific perspective and simulation data.
- The Scientist and Engineer's Guide to Digital Signal Processing: Butterworth Filter — A free PDF chapter from the DSP guide focusing on the theory and implementation of Butterworth filters within digital signal processing contexts.