


Real-Time Energy Monitor with Arduino and LabVIEW
#arduino
#LabVIEW
#energy monitoring
#XBee
#photoresistor
#real-time data
#USB communication
#data processing
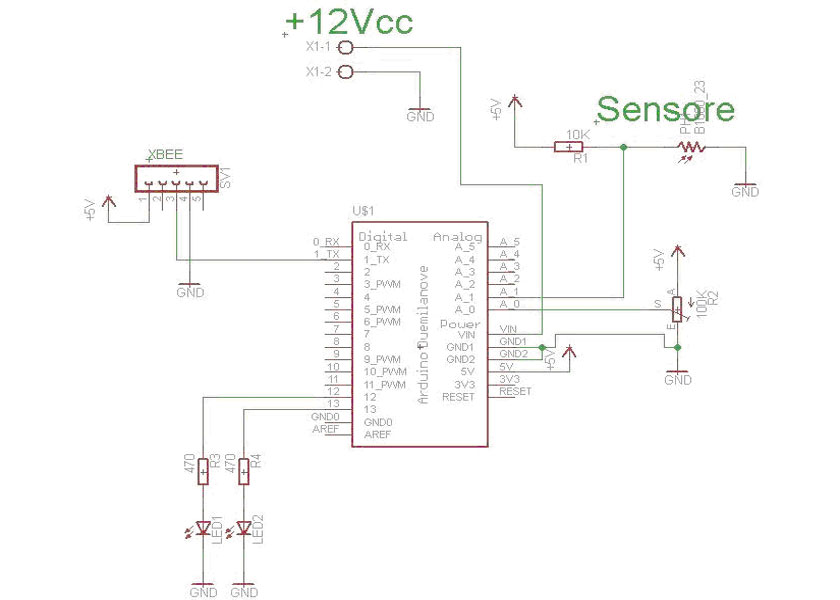
Description: The system consists of two components: an Arduino board that detects LED pulses and transmits the data via an XBee module, and a PC that receives the data through a USB/XBee module and processes it using LabVIEW, allowing for real-time analysis of energy consumption. To detect the LED blinking, a photoresistor should be placed above the LED and covered with black tape. The Arduino reads the analog voltage through a resistive divider. The LED blinking causes a voltage drop, which is read by the Arduino and compared with the voltage from a potentiometer connected to channel A0. The potentiometer adjusts the sensitivity threshold. The code includes delays and conditions to manage the acquisition of voltage readings, flag settings, and time measurement for LED cycles. Data is sent to the PC via the serial port, including a marker for LabVIEW to recognize the readings. The system also counts cycles and averages energy consumption over five minutes, with specific tasks for timing and LED blinking.
The electronic system integrates an Arduino board with an XBee module for wireless communication and a photoresistor for LED pulse detection. The circuit operates by detecting voltage changes caused by LED blinking, which is crucial for measuring energy consumption. The photoresistor is strategically placed above the LED and shielded from ambient light to minimize interference. A resistive voltage divider is employed to scale the voltage levels for accurate analog readings by the Arduino.
The Arduino is programmed to read the voltage from the photoresistor and the potentiometer, which sets the sensitivity threshold. The comparison between these two readings determines whether the LED is blinking. When the photoresistor voltage exceeds the potentiometer voltage, a flag is set, indicating active detection. This flag enables the Arduino to track the time elapsed since the last detected blink using the `millis()` function, which returns the number of milliseconds since the board began running the current program.
Data transmission to the PC is initiated by sending a marker followed by the elapsed time in milliseconds. This data flow is crucial for real-time monitoring in LabVIEW, allowing users to visualize energy consumption patterns. The system includes mechanisms to reset the detection flag when the LED is off, ensuring accurate cycle counting. A counter increments with each detected pulse, facilitating the calculation of average energy consumption over a specified duration, such as five minutes.
Additionally, the system incorporates a timing function that blinks an LED at regular intervals, providing visual feedback of system activity. The use of defined constants for pin assignments and timing intervals enhances code readability and maintainability. Overall, this setup exemplifies an effective integration of hardware and software for real-time energy monitoring applications.The system consists of two parts: the Arduino board that detects the led pulses and sends the data via the XBee module, and a PC that recive the data through a USB/Xbee module and processes the data with LabVIEW so you can prepare and study the consumption in a very instant. To detect the LED blinking you have to apply a simple photoresistor above the led and covered it with black tape. To read the analog voltage using the Arduino you have to use a resistive divider as shown in diagram: The LED blinking causes the voltage drop down and this value is read by Arduino and compared with the voltage acquired by the potentiometer connected in the channel A0. This potentiometer has the task to adjust the sensitivity threshold. delay(10); //10ms val_pot = analogRead(POT); delay(10); //10ms val_sensore = analogRead(SENSORE); if(val_sensore > val_pot)&(flag_acquire = 0){ flag_acquire = 1; digitalWrite(LED, LOW); With this code Arduino acquires the two voltages, the photoresistor voltage compared with the voltage of the potentiometer, if the value is greater than the sketch actives the flag flag_acquire = 1 ³, then read how much time has passed to another flash.
To do this use arduino to read a statement in an internal counter that returns the milliseconds since power on. The instruction is millis () code here: There are 2 variables pre_tmS and cur_tmS, cur_tmS needs to read the current value of the internal counter: cur_tmS = millis (); Then if the condition (cur_tmS> pre_tmS) is true, I note the elapsed time between cycles, ie between the LED ON and the next cycle of the LED ON and write it on the variable pre_tmS .
Now we have to send to the PC via the serial port using XBee with these instructions: First Arduino sends a marker S used to labview to recognize that this value is part of the reading that real-time instant, then send the value in milliseconds elapsed. Now you have to reset the flag when the LED goes OFF using this statement: if(val_sensore < val_pot)&(flag_acquire = 1){ flag_acquire = 0; digitalWrite(LED, HIGH); impulsi+; delay(10); //10ms } You have to check the voltage acquired by the sensor, if it falls below the potentiometer value and the flag is active flag_acquire = 1 ³ then you have to reset the flag.
Note that the statement impulsi+; is simply a counter that counts the cycles of the LED power meter, this is to make an average energy consumed every 5 minutes. The third task is similar to the first task, wait 1 second, and increments the counter time_flag+, which is the fourth task of counting 300secondi (5 minutes).
In addition, this task blinks the LED connected to pin 12 at a rate of 1 second. The fourth task as mentioned above waiting 5 minutes and then sent via serial marker L is used to program labview to recognize that the data sent is the data on the average found in 5 minutes. #define POT 0 #define SENSORE 1 #define LED 13 #define LED1sec 12 // definire il tempo casuale che varia tra 40ms e 250ms #define TimeAcquire 1000 //1sec #define Time5Minuts 300 //5 minuti = 300sec unsigned long cur_tm = millis(); unsigned long pre_tm = cur_tm; unsigned int tm_diff = 0; unsigned long cur_tmS = millis(); unsigned long pre_tmS = cur_tmS; unsigned int tm_diffS = 0; unsigned int time_flag=0; unsigned int impulsi=0; unsigned int val_pot=0; unsigned int val_sensore=0; char flag_acquire=0; char flag_time=0; void setup() { pinMode(LED, OUTPUT); pinMode(LED1sec, OUTPUT); Serial.
begin(115200); // setup serial 115200 Serial. println("ENEL KW/h reader!"); } void loop() { //Acquisisco delay(10); //10ms val_pot = analogRead(POT); // read the input pin delay(10); //10ms val_sensore = analogRead(SENSORE); // read the input pin if(val_sensore > val_pot)&(flag_acquire = 0){ flag_acquire = 1; digitalWrite(LED, LOW); pre_tmS = cur_tmS; cur_tmS = millis(); if( cur_tmS > pre_tmS ) { tm_diffS = cur_tmS - pre_tmS; } Serial. print("S"); Serial. println(tm_diffS); d
The electronic system integrates an Arduino board with an XBee module for wireless communication and a photoresistor for LED pulse detection. The circuit operates by detecting voltage changes caused by LED blinking, which is crucial for measuring energy consumption. The photoresistor is strategically placed above the LED and shielded from ambient light to minimize interference. A resistive voltage divider is employed to scale the voltage levels for accurate analog readings by the Arduino.
The Arduino is programmed to read the voltage from the photoresistor and the potentiometer, which sets the sensitivity threshold. The comparison between these two readings determines whether the LED is blinking. When the photoresistor voltage exceeds the potentiometer voltage, a flag is set, indicating active detection. This flag enables the Arduino to track the time elapsed since the last detected blink using the `millis()` function, which returns the number of milliseconds since the board began running the current program.
Data transmission to the PC is initiated by sending a marker followed by the elapsed time in milliseconds. This data flow is crucial for real-time monitoring in LabVIEW, allowing users to visualize energy consumption patterns. The system includes mechanisms to reset the detection flag when the LED is off, ensuring accurate cycle counting. A counter increments with each detected pulse, facilitating the calculation of average energy consumption over a specified duration, such as five minutes.
Additionally, the system incorporates a timing function that blinks an LED at regular intervals, providing visual feedback of system activity. The use of defined constants for pin assignments and timing intervals enhances code readability and maintainability. Overall, this setup exemplifies an effective integration of hardware and software for real-time energy monitoring applications.The system consists of two parts: the Arduino board that detects the led pulses and sends the data via the XBee module, and a PC that recive the data through a USB/Xbee module and processes the data with LabVIEW so you can prepare and study the consumption in a very instant. To detect the LED blinking you have to apply a simple photoresistor above the led and covered it with black tape. To read the analog voltage using the Arduino you have to use a resistive divider as shown in diagram: The LED blinking causes the voltage drop down and this value is read by Arduino and compared with the voltage acquired by the potentiometer connected in the channel A0. This potentiometer has the task to adjust the sensitivity threshold. delay(10); //10ms val_pot = analogRead(POT); delay(10); //10ms val_sensore = analogRead(SENSORE); if(val_sensore > val_pot)&(flag_acquire = 0){ flag_acquire = 1; digitalWrite(LED, LOW); With this code Arduino acquires the two voltages, the photoresistor voltage compared with the voltage of the potentiometer, if the value is greater than the sketch actives the flag flag_acquire = 1 ³, then read how much time has passed to another flash.
To do this use arduino to read a statement in an internal counter that returns the milliseconds since power on. The instruction is millis () code here: There are 2 variables pre_tmS and cur_tmS, cur_tmS needs to read the current value of the internal counter: cur_tmS = millis (); Then if the condition (cur_tmS> pre_tmS) is true, I note the elapsed time between cycles, ie between the LED ON and the next cycle of the LED ON and write it on the variable pre_tmS .
Now we have to send to the PC via the serial port using XBee with these instructions: First Arduino sends a marker S used to labview to recognize that this value is part of the reading that real-time instant, then send the value in milliseconds elapsed. Now you have to reset the flag when the LED goes OFF using this statement: if(val_sensore < val_pot)&(flag_acquire = 1){ flag_acquire = 0; digitalWrite(LED, HIGH); impulsi+; delay(10); //10ms } You have to check the voltage acquired by the sensor, if it falls below the potentiometer value and the flag is active flag_acquire = 1 ³ then you have to reset the flag.
Note that the statement impulsi+; is simply a counter that counts the cycles of the LED power meter, this is to make an average energy consumed every 5 minutes. The third task is similar to the first task, wait 1 second, and increments the counter time_flag+, which is the fourth task of counting 300secondi (5 minutes).
In addition, this task blinks the LED connected to pin 12 at a rate of 1 second. The fourth task as mentioned above waiting 5 minutes and then sent via serial marker L is used to program labview to recognize that the data sent is the data on the average found in 5 minutes. #define POT 0 #define SENSORE 1 #define LED 13 #define LED1sec 12 // definire il tempo casuale che varia tra 40ms e 250ms #define TimeAcquire 1000 //1sec #define Time5Minuts 300 //5 minuti = 300sec unsigned long cur_tm = millis(); unsigned long pre_tm = cur_tm; unsigned int tm_diff = 0; unsigned long cur_tmS = millis(); unsigned long pre_tmS = cur_tmS; unsigned int tm_diffS = 0; unsigned int time_flag=0; unsigned int impulsi=0; unsigned int val_pot=0; unsigned int val_sensore=0; char flag_acquire=0; char flag_time=0; void setup() { pinMode(LED, OUTPUT); pinMode(LED1sec, OUTPUT); Serial.
begin(115200); // setup serial 115200 Serial. println("ENEL KW/h reader!"); } void loop() { //Acquisisco delay(10); //10ms val_pot = analogRead(POT); // read the input pin delay(10); //10ms val_sensore = analogRead(SENSORE); // read the input pin if(val_sensore > val_pot)&(flag_acquire = 0){ flag_acquire = 1; digitalWrite(LED, LOW); pre_tmS = cur_tmS; cur_tmS = millis(); if( cur_tmS > pre_tmS ) { tm_diffS = cur_tmS - pre_tmS; } Serial. print("S"); Serial. println(tm_diffS); d
isolated mains power monitoring arduino
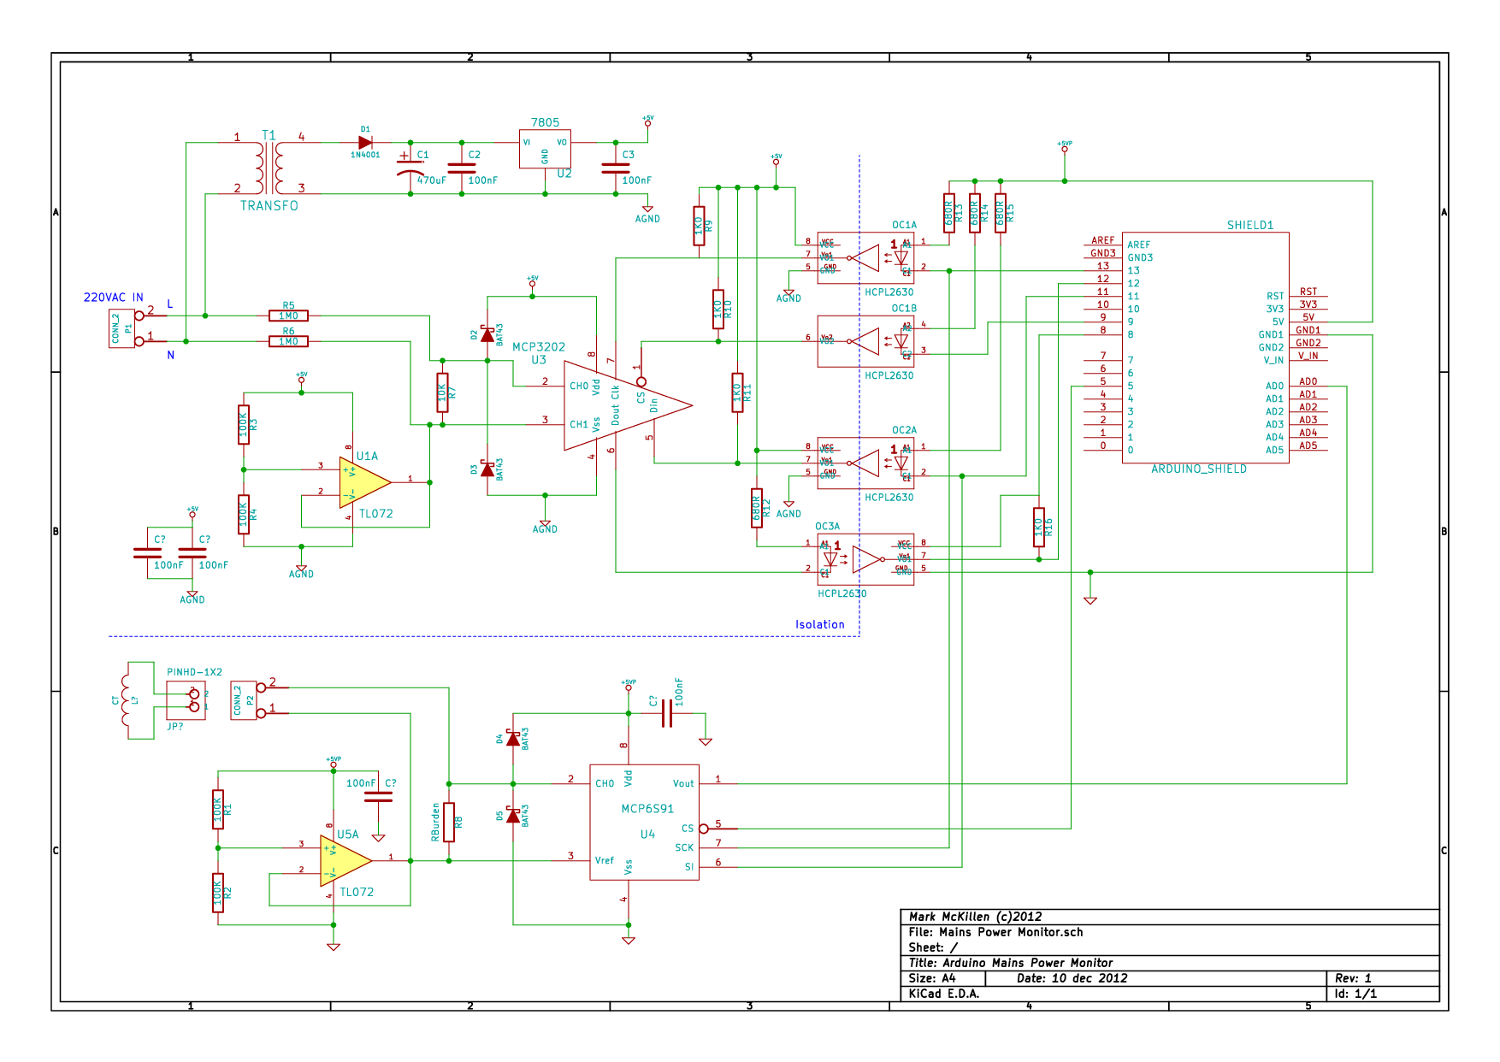
A mains (220-240VAC) power monitoring circuit has been sought for interfacing with an Arduino. While the OpenEnergyMonitor solution employs a transformer for isolation and measurement of mains voltage, it has been noted that the transformer does not couple effectively to...
arduino based thermorbios weather station receiver
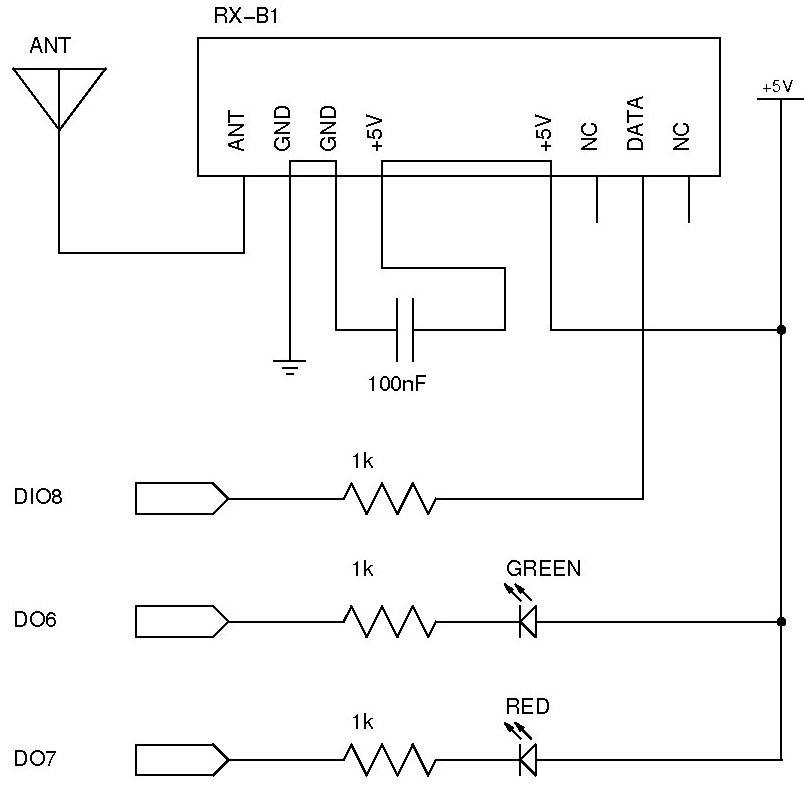
The documentation and code cleaning for the Jaycar Thermor/BIOS branded wireless weather station receiver has been completed. The code is based on the Practical Arduino weather station receiver project. The process involved analyzing the RF signal from the weather station...
DOGM128 with Arduino Hardware
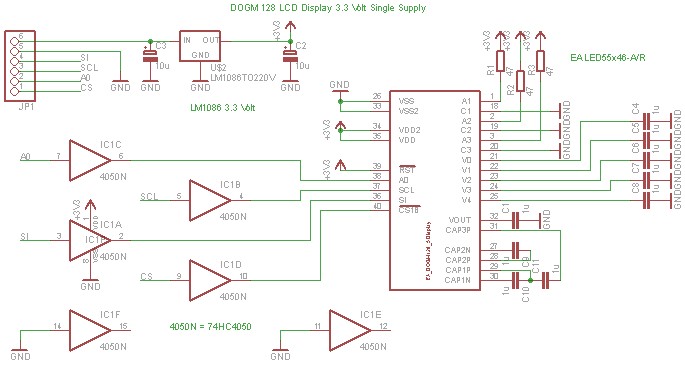
The DOGM graphics module should be connected to the Arduino board as illustrated. Pin 12 (MISO) of the Arduino board must remain unused. Furthermore, the DOGM graphics module requires an address line (A0), which can be connected to any output...
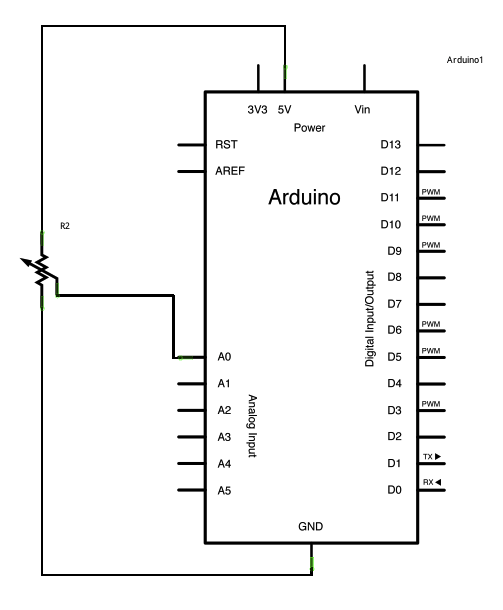
Arduino Analog Input
A potentiometer is a simple knob that provides variable resistance, which can be read into the Arduino board as an analog value. In this example, a potentiometer is connected to one of the Arduino's analog inputs to control the rate...
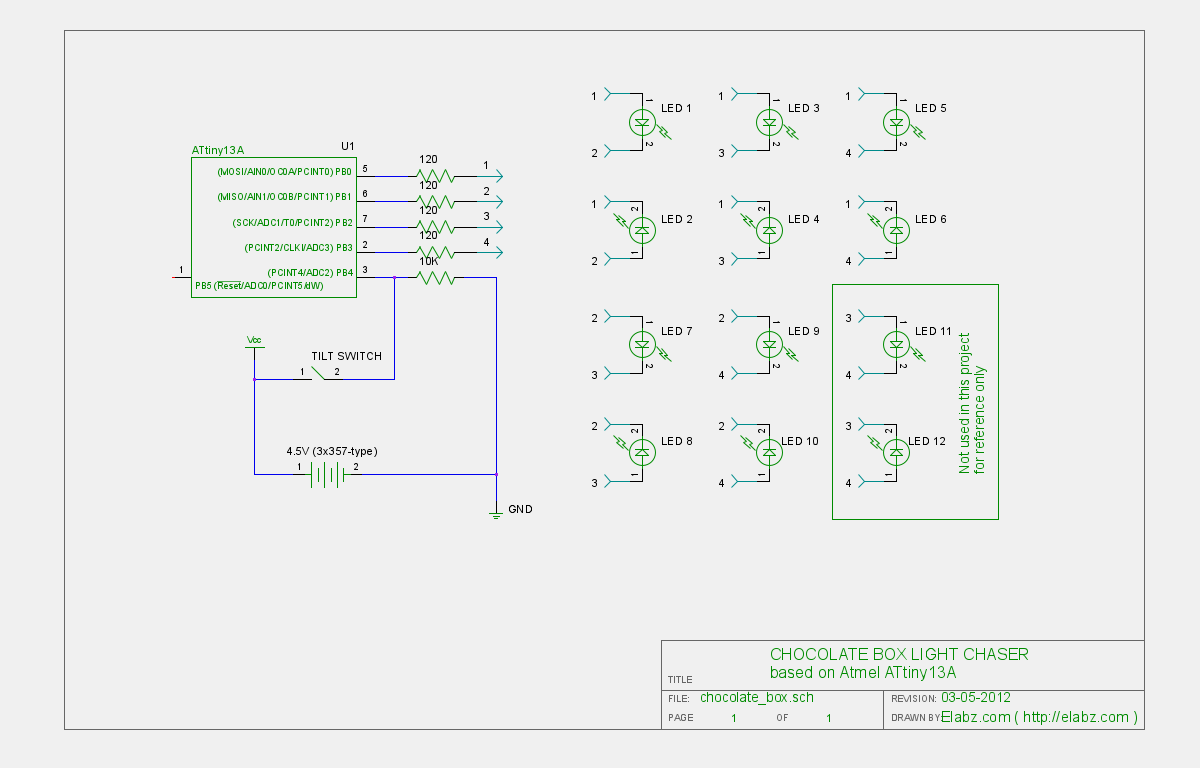
Pimp Your Chocolates with Arduino IDE and ATTiny13
Transform a standard chocolate box into an impressive LED blinking display using an ATTiny13 AVR microcontroller, Arduino IDE, and several electronic components.
The project involves creating an eye-catching LED display housed within a chocolate box. The core of the circuit is...
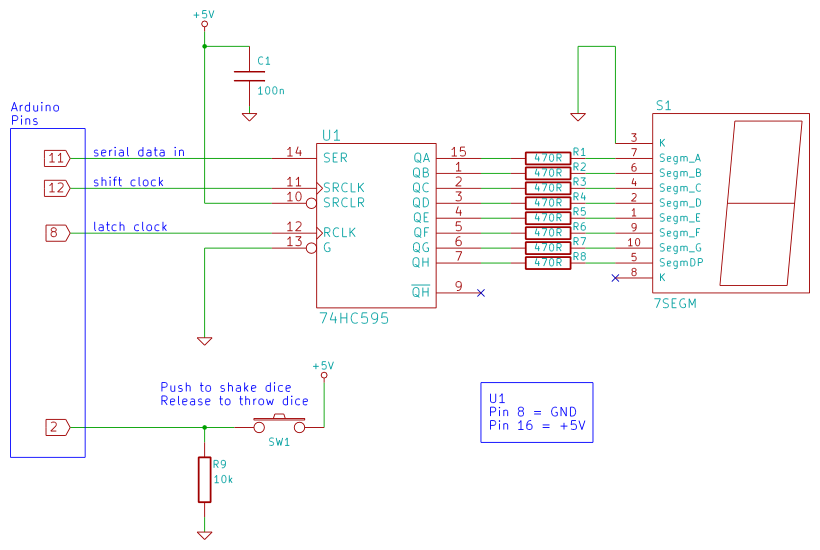
arduino dice
Arduino 7-segment display dice circuit and tutorial with Arduino sketch. Build a dice that is shaken by holding a button in and thrown by releasing the button. The shake, throw, and number thrown are animated and displayed on a seven-segment...
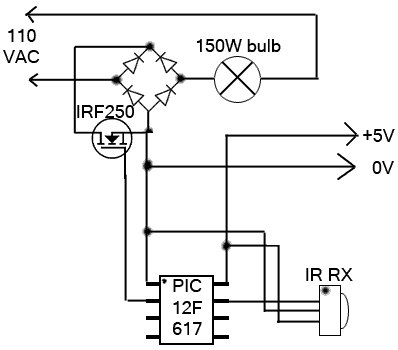
AC Arduino dimming circuit
This circuit is designed for dimming devices powered by transformer-based power supplies, specifically those operating at 12, 24, or 48 volts, rather than standard 120 volts. The project involves various components, including a soldering iron, wire strippers, breadboard or perf...
Modular Music Box Arduino polyphonic audio
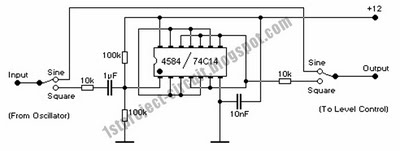
Prior to emailing Pablo Gian Villamil, he provided a link to his class notes on generating polyphonic sound with Arduino. Efforts were made to understand his circuitry through various blog posts and component listings, including the CMOS Hex Schmitt Trigger...
Hercules: The Motion Controlled Android Robot using Arduino
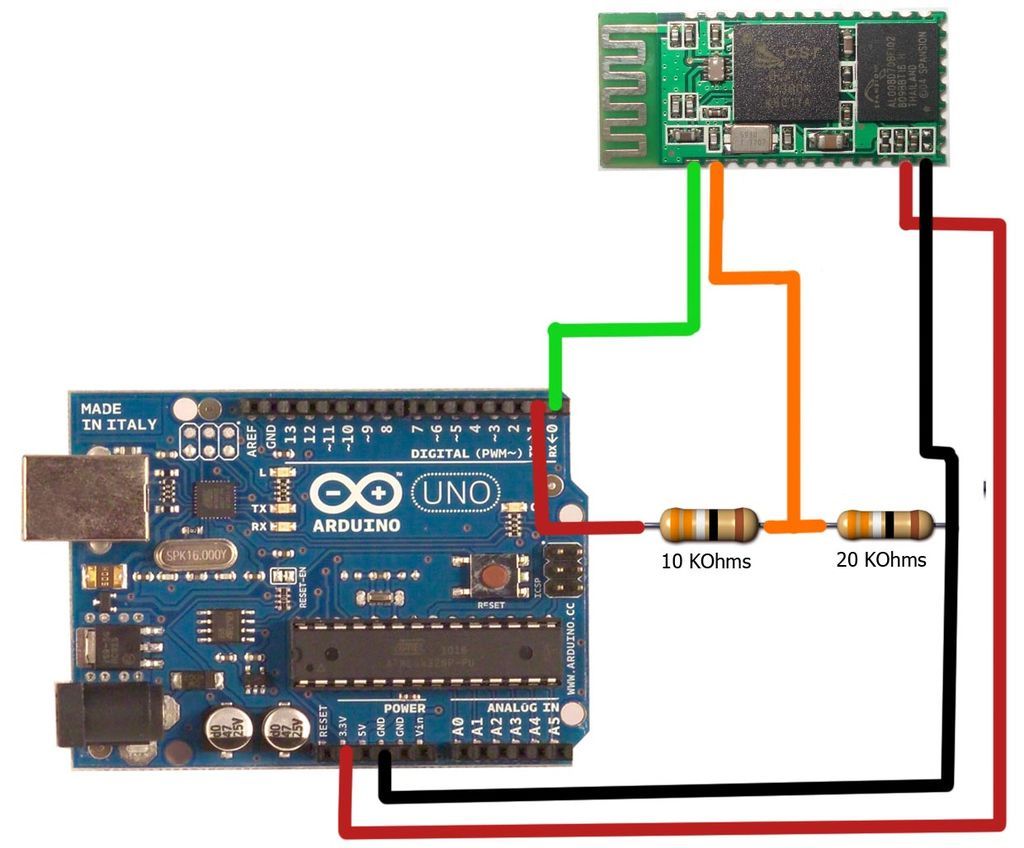
The motion games on the Nokia 5800 sparked an interest in creating a real-world version of a racing car controlled by tilting a phone. The motion-controlled robot, named Hercules due to its high torque and speed, is operated via Bluetooth...