
Discussing Measuring Flash Duration
The approach of converting signals to audio and utilizing Audacity for measurement offers an innovative way to analyze TTL flash control pulses. Previous attempts with similar sensors and Arduino's PulseIn() function resulted in erratic outcomes when comparing flash durations across various units, possibly due to saturation effects from brighter flashes. The selection of the parallel resistor may influence these results. Additionally, partial decoding of the YN ST-E2's HSS signal revealed the potential for visualizing TTL signals, which can be utilized to trigger a TTL flash through a simple circuit. An FM radio transmitter circuit was developed to relay TTL signals from the ST-E2, activating a remote YN 565 flash. However, the use of a digital FM radio introduced a delay, disrupting the pre-flash timing and resulting in full power output from the camera.
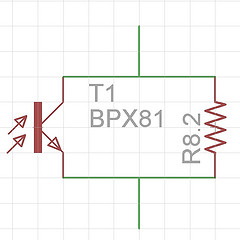
A custom PC program was created to automate calculations, including T.1 and T.5, with a unique approach that involves integrating the curve to determine the area under the curve, which correlates with the energy released. T.1 is defined as the point at which total energy reaches 90% of the total area. While obtaining precise measurements with this setup is challenging, it is sufficient to contest manufacturers' claims, particularly when discrepancies between true values and stated specifications are significant. The lack of transparency from manufacturers regarding accurate figures is concerning, as some resort to vague descriptions, further complicating the comparison process. Consistency in using identical photodiodes and resistors is expected to yield similar results across tests.Here is simple method that you can try. It might NOT be as accurate as scientific professional tools, but seems more accurate than some of the manufacturers. Wire the resistor in parallel with the photodiode to reduce saturation effect. Normally, wire the positive terminal of the photodiode to the sleeve and the negative terminal to the tip.
Some sound card requires the other way around. The software used in this thread is a free software named Audacity. I think it has PC and Mac version. Please google it because I don`t want to sound like their sales rep. Plug the hardware you made into the microphone port, if you have multiple sound cards, select the right one. Important note, set the sampling rate to the highest allowed by your hardware so it is more accurate, particularly when capturing 1/128 power level.
The above capture is for YN560 first generation at 1/1 power level. As you can see, the curve starts at 28 samples and end at 560 smaples. At 96000 sample rate, this is about (560 - 28) / 96000 = 5. 54ms. This number is a bit large, probably caused by the 1k ohms resistor - it too large and could not dissipate the energy by the photodiode fast enough. The bottom line is, this method might not give you absolute result, but it gives you reasonable close number given its crudity.
But if you are comparing flash durations with another brand, since you are using same setup, it will give you relative numbers to compare. Key point of doing comparisions is to keep everything securely positioned, same distance, and point the flash head on to the sensor at about 1 meter distance.
Thanks! Interesting approach. I love the idea of converting to an audio signal and using Audacity to measure it. I`m hoping I`ll be able to record TTL flash control pulses this way. Question: I`ve tried doing something similar using the same type of sensor and the PulseIn() function on an Arduino, which supposedly will handle down to 10 microseconds. But I got very erratic results when trying to compare the durations of different kinds of flash units.
I was guessing that brighter flash units saturate the photodiode more quickly, leading to longer apparent durations. Could this be solved via selection of the parallel resistor [edit] However, this is how I decoded YN ST-E2, well partially, when it sends out HSS signal.
It is interesting to see TTL signals visually and if you know how to construct a simple circuit, you can play it back and trigger a TTL flash. I did a circuit that uses FM radio transmitter to transmitt TTL signals from ST-E2 and have a FM radio hooked up an IR LED to trigger a remote YN 565, it worked well except I used a dgital FM radio that inserts a delay, so the pre-flash is messed and camera always send full power (because the preflash arrived too late due to delay).
I actually wrote a PC program to automate all these, including calculation of T. 1, T. 5, My formula is a abit different in that I actually take the integral of the curve, ie the area under curve, which should be proportional to energy released, T. 1 in my case is when total energy is 90% of all (area under curve). Anyways, it is kind of hard to get REAL measurement with this setup, but should be close enough to dispute with whatever manufacturers claim to be because the difference between TRUE value and the claim is just too large.
Anyways, it is kind of hard to get REAL measurement with this setup, but should be close enough to dispute with whatever manufacturers claim to be because the difference between TRUE value and the claim is just too large. Just why the manufacturers simply don`t quote appropriate figures is ridiculous. Some manufacturers avoid this by being vague - I`m not sure which is worse. If using the exact same photodiode and resister should we all expect to be getting the same results for the same
🔗 External reference
Related Circuits
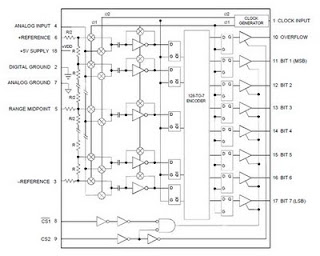
The ADC 207 is the first analog-to-digital converter to utilize Flash Converting technology based on an advanced high-speed VLSI 1.2-micron CMOS process. This innovative process enhances the unique capabilities of the ADC 207, providing excellent speed, good linearity, and...
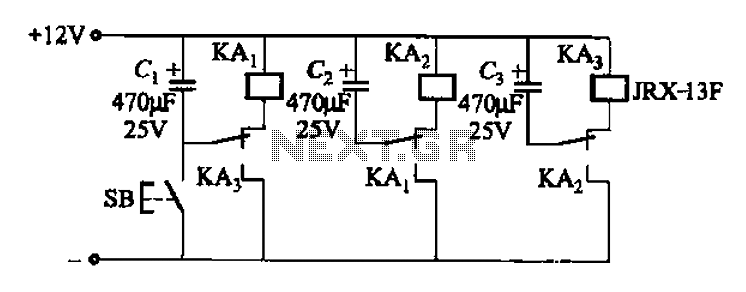
The relay control allows for multiple pairs of contacts to be connected in parallel, enabling the circuit to handle a large lamp power. The design is straightforward; by simply changing the capacitance of the capacitor, different flash frequencies can...
This simple LED flasher circuit will alternately turn ON and OFF two LEDs. The first LED will illuminate when the second LED is OFF for a certain duration, and then the process will repeat. The LED flasher circuit operates using...

The M-88L70 is a complete DTMF receiver that combines both band-split filter and decoder functions into a single 18-pin DIP or SOIC package. It is manufactured using CMOS process technology, which allows for low power consumption (maximum 18 mW),...
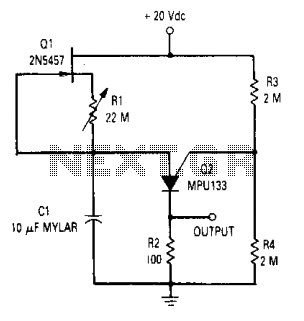
The time circuit can provide a time delay of up to 20 minutes. The circuit is a standard relaxation oscillator with a FET current source in which resistor R1 is used to provide reverse bias on the gate-to-source of...
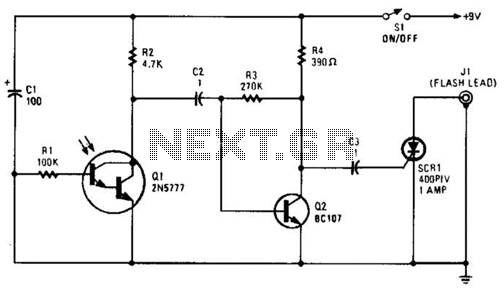
The phototransistor Q1 receives a light pulse from a photoflash unit. The pulse is AC-coupled to amplifier Q2, which subsequently triggers SCR1, activating a flash unit connected to J1. The circuit begins with the phototransistor Q1, which is sensitive to...
Warning: include(partials/cookie-banner.php): Failed to open stream: Permission denied in /var/www/html/nextgr/view-circuit.php on line 713
Warning: include(): Failed opening 'partials/cookie-banner.php' for inclusion (include_path='.:/usr/share/php') in /var/www/html/nextgr/view-circuit.php on line 713