
PIC based Oscilliscope
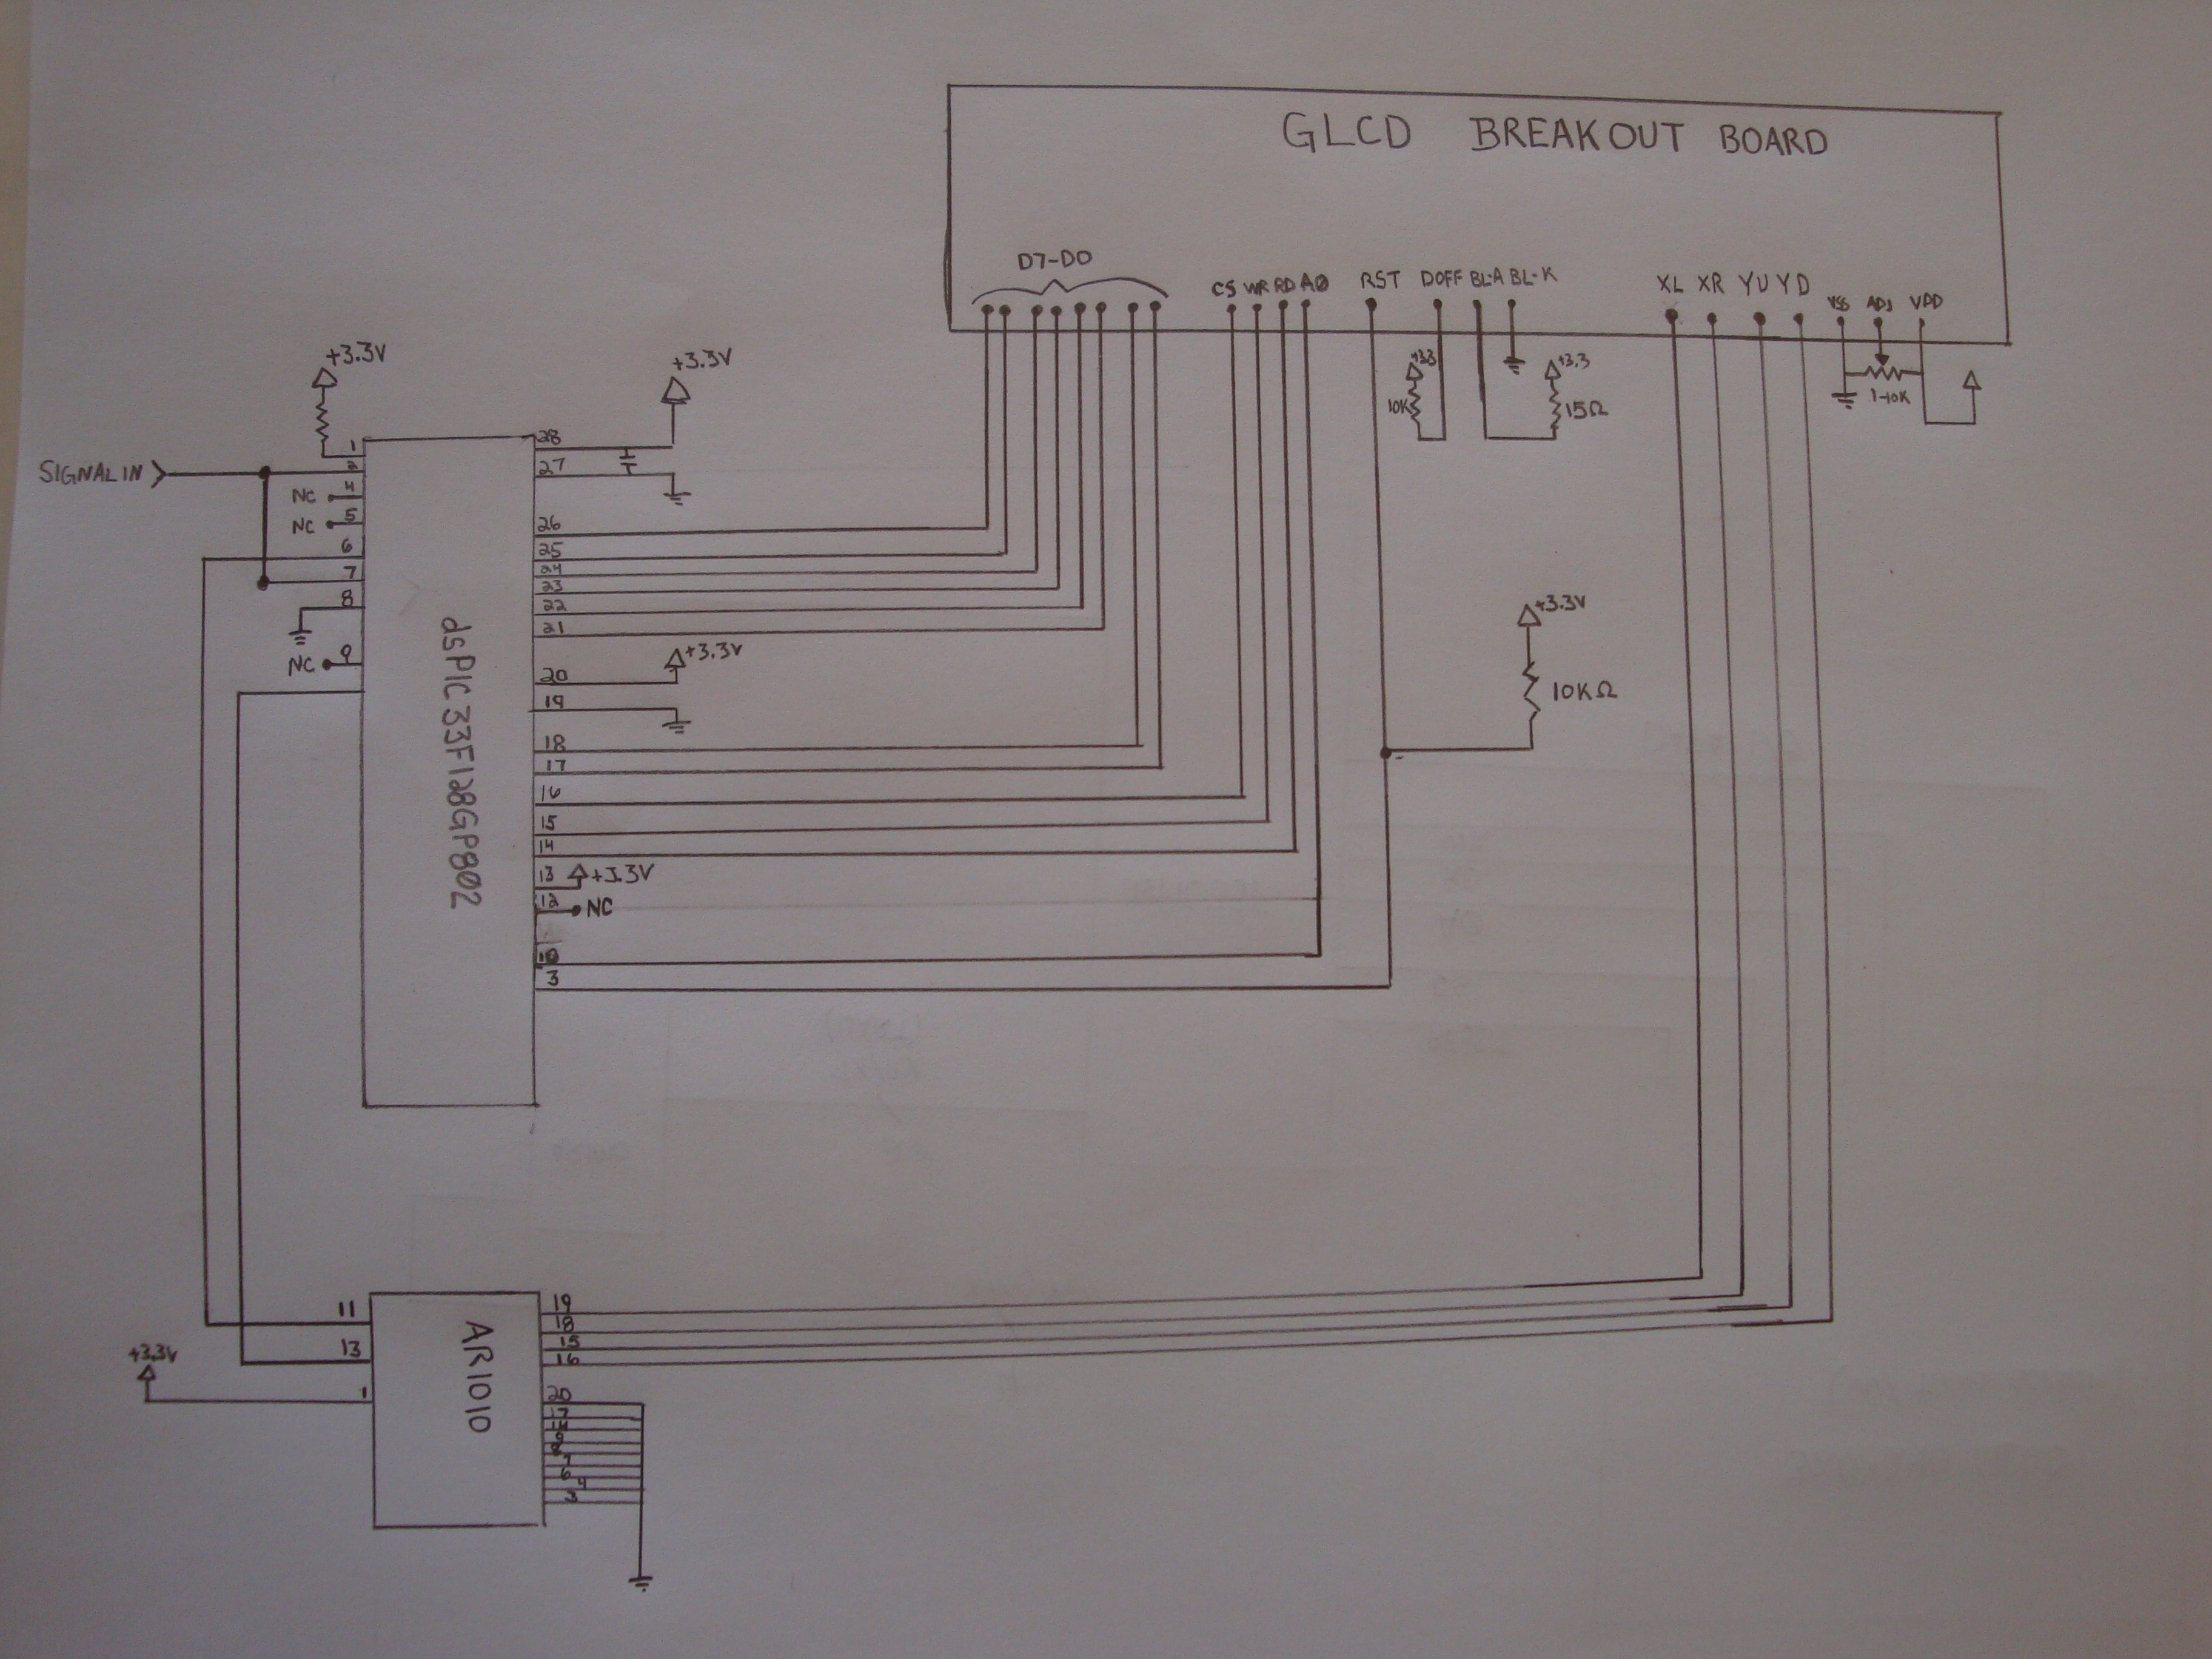
The project centers around creating a digital oscilloscope that utilizes a dsPIC33FJ128GP802 microcontroller, which is equipped with a 24-bit ADC capable of high-speed sampling. This microcontroller's architecture allows for efficient data handling and processing, making it well-suited for applications that require real-time data analysis. The integration of a graphic LCD display enables visual representation of the sampled waveforms, while the touchscreen interface provides user interactivity for a more intuitive experience.
To manage the varying input voltage levels, a voltage divider will be implemented to scale down higher voltage signals to the safe operating range of the microcontroller. The choice of an op-amp for impedance matching ensures that the ADC receives a signal that is both isolated and appropriately scaled, thus protecting the microcontroller from potential damage. The use of a dedicated touchscreen controller alleviates resource constraints on the microcontroller, allowing it to focus on data acquisition and processing tasks.
The software will employ a layered graphical rendering approach, which optimizes performance by minimizing the need to redraw static elements of the display. The implementation of a trigger system utilizing the onboard comparator and DAC will further enhance the oscilloscope's functionality by allowing precise control over when sampling begins, thus facilitating accurate waveform capture.
Overall, this project embodies a comprehensive approach to designing a digital oscilloscope that balances hardware selection, software architecture, and user interface design, resulting in an effective and versatile tool for waveform analysis.In order to accomplish this my initial thought is to sample an input (ADC) at consistant time increments and then display the waveform on a graphic lcd display. If I want to change the time scale I can just change the rate of time between samples, and if I want to increase the voltage scale I can scale the measured values by some multiple.
With that basic concept, this project will require an ADC, microcontroller, graphic lcd, and some form of input. After doing a bit of search for the LCD display this link was selling a 4 inch display with touch screen for a mere $25 (which is dirt cheap for that type of resolution if you check sparkfun or other website). So now I had the display and the input source, though more thought will be needed to have graphical interface, the next item to tackle was the ADC.
I had a few 24bit Microchip microcontrollers that had onboard ADC that could sample at 1. 1 Msps, as they were designed to be optimized for digital signals. Not only that but they can sample multiple channels at one time which would be good for a two channel oscilliscope (if I decide to upgrade later on). The chip is a dsPIC33FJ128GP802, and it also has the capability to do sampling in the background while filling up an onboard DMA so that the only work in code will be to draw the display, plot the data, and handle inputs.
The dsPIC33 is a 16 bit processor as opposed to the 8 bit processors which makes math on larger values much easier and quicker. On that same note, it also can run up to 40 MIPS so there should be plenty of speed if math operation may be needed to do an FFT or other analysis of data.
Initially in testing I was interfacing the touch screen with an onboard ADC of the microcontroller, but after thinking about how that ties up a resource I decided to go with a dedicated touch screen controller the AR1010, which is another Microchip product. I`m not trying to show a bias, I was able to get free samples of both chips (uC and Touch Controller) so they kept the budget low, and I really like the organization of datasheet put out by Microchip.
There is still one looming problem, and that is the fact that the dsPIC only works at voltage levels of 3. 5 volts. This isn`t very useful if 5/12/24 volt waveforms want to be analyzed (I left out 120 because of safety issue that I don`t want to mess around with).
So in order to scale down the signal I`ll need some sort of voltage divider network and an opamp to isolate and match the impedance of the dsPIC`s ADC input. Basically I would rather destroy a generic op amp before I hurt the main controller of this project. An idea I found from Texas Instrument was this, and I have ordered samples of their opamps to try and design this circuit but they don`t come in a DIP package.
Another idea I found was here, which is from an AVR base oscilliscope and it just uses some generic opamps. So above breifly explains the hardware, the theory of software is to draw/plot data on the display using a layered method (see lcd controller datatsheet S1D13700 ) where the plot is on the back layer and the graph lines and touch interface displays are on the front.
This way only the plot has to be redrawn every time the buffer fills. In order to have clear signal (ie the waveform isn`t always bouncing around) there has to be some type of trigger. For this I am going to try to use the onboard comparater and DAC of the dsPIC to start the sampling at a consistant voltage level that is inphase (positive going or negative going) with the previous sample.
The DAC will act as the reference point and allow for an adjustable trigger, while the comparator will allow for an interupt when a threshold is passed. As of now there is a generically working oscilliscope and spectrum analyzer that display the wave form and can calculate the frequency.
🔗 External reference
Related Circuits
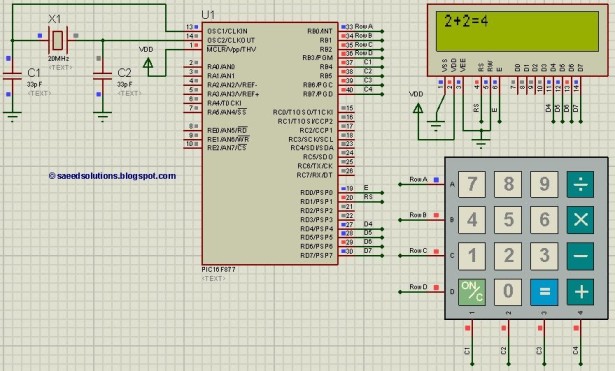
This PIC microcontroller tutorial provides a simple calculator implementation for the PIC16F877 microcontroller. This is a straightforward one-digit calculator. The PIC16F877 microcontroller is a versatile and widely used device in embedded systems, particularly for educational purposes and simple applications. The...
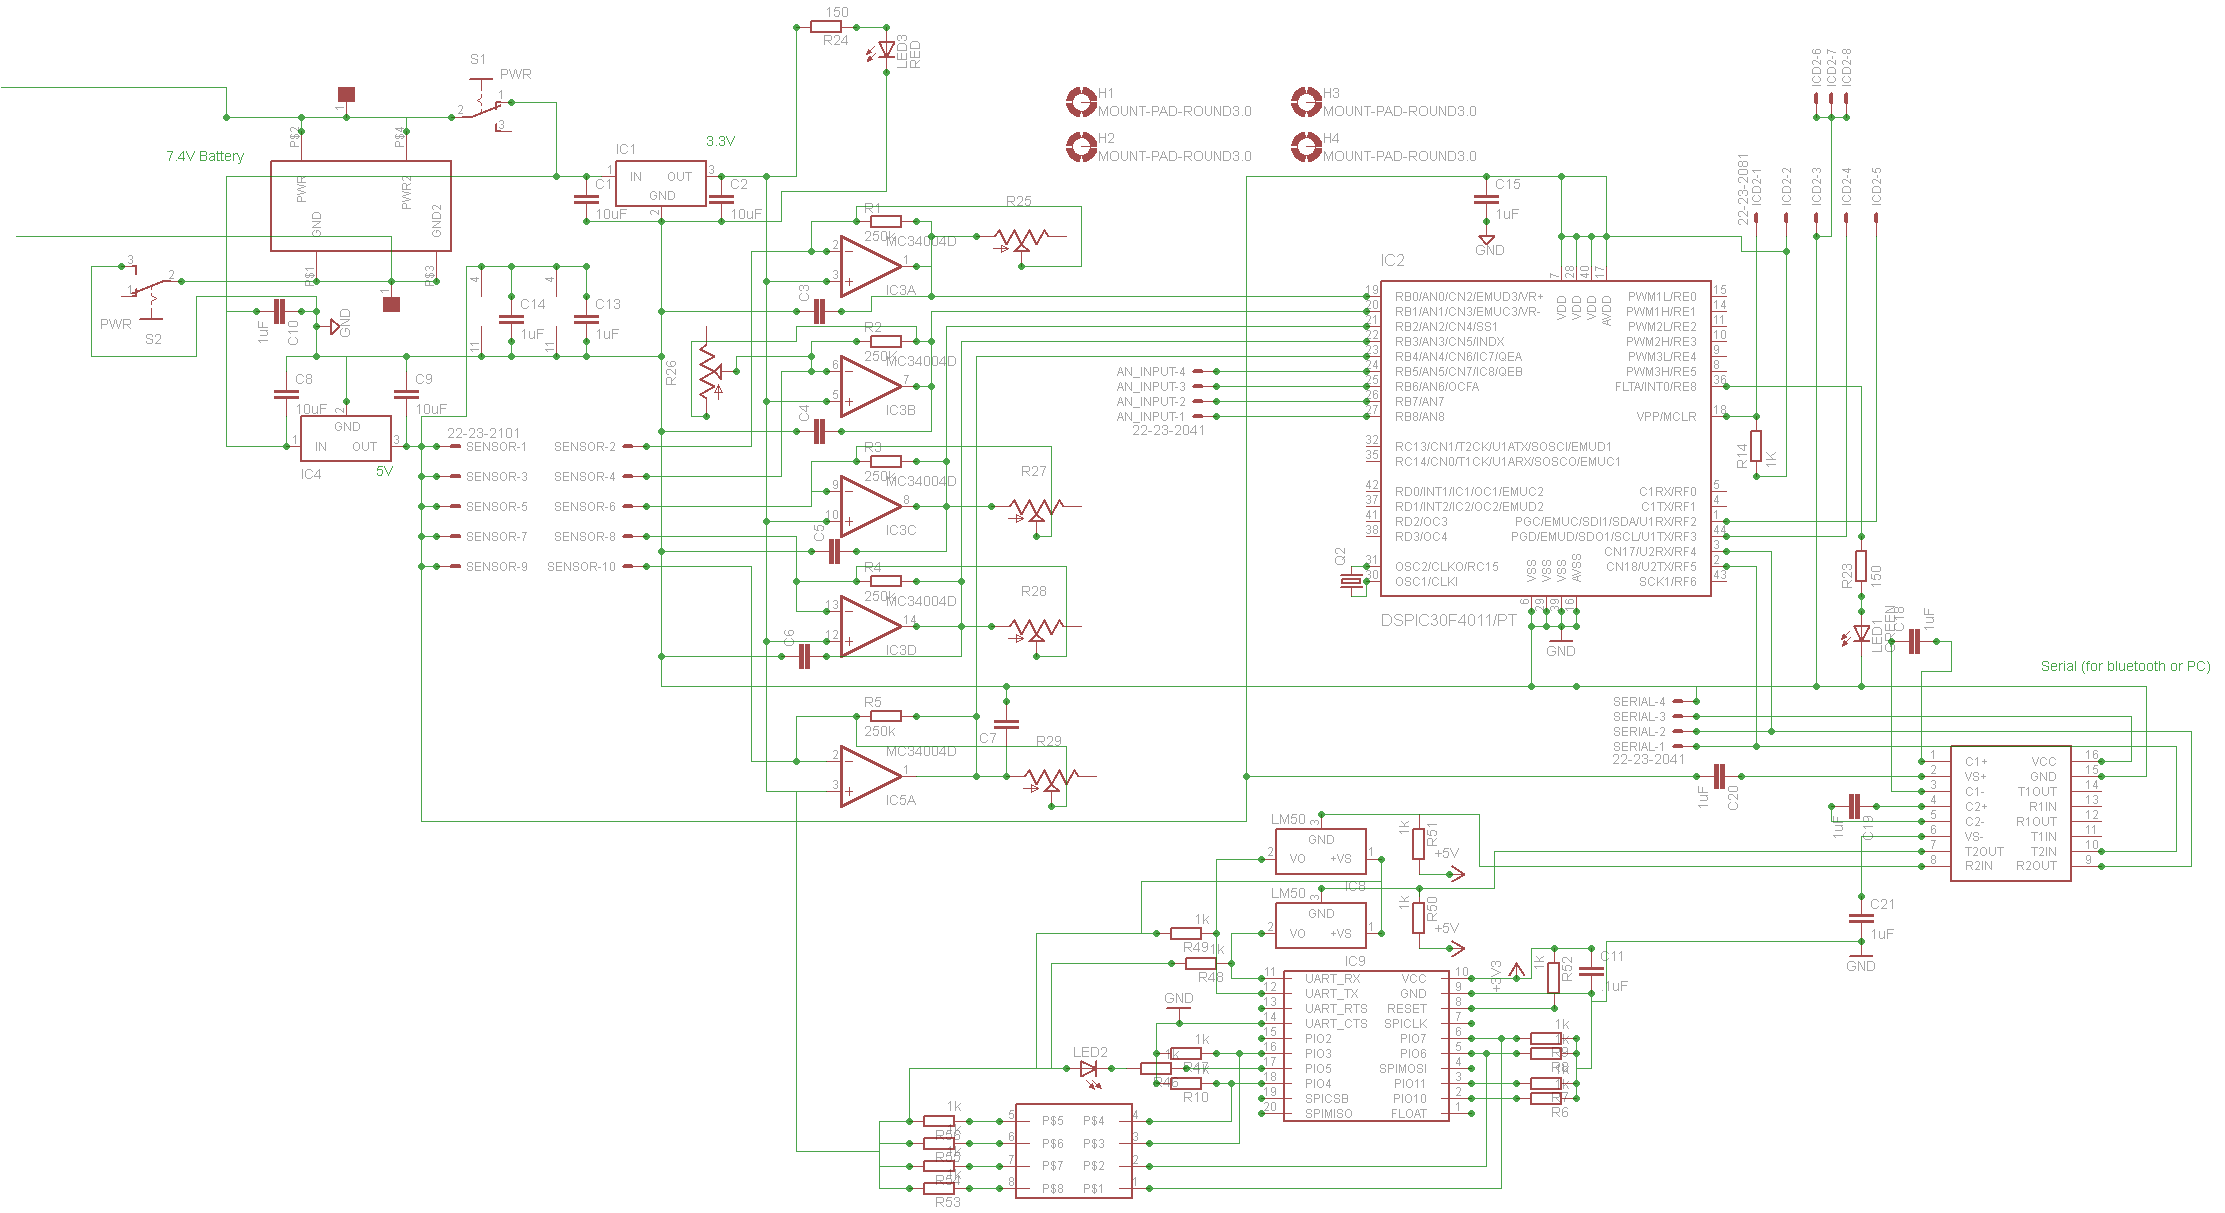
Connect a PIC microcontroller to an RN-41 Bluetooth module. The PCB was not designed by the current user, so the rationale behind the circuit's design, which differs from the voltage divider method used by others, is unclear. The 5V...
The Multimeter Clock consists of three multimeters, the first meter displays hours, the second displays minutes and the last displays seconds. A 16F628A PIC microcontroller keeps track of time and outputs a calculated current to each meter to display...
An Xbox controller rapid fire modification requires a chip that can send a ground signal quickly to a specific point. The desired solution should replace a previously used 555 timer due to its size. The project necessitates a microcontroller...
A versatile package containing numerous potential projects. This development board is designed for 28-pin PIC microcontrollers and includes a power supply circuit, a crystal oscillator circuit, an RS232 port, an ICSP/ICD port, and a 16x2 alphanumeric Supertwist LCD. The development...
This simple microcontroller circuit regulates a servo motor based on a 3-state switch. The servo motor functions as an actuator with three positions. It consists of three wires: one for VCC, one for ground, and a third for position...
Warning: include(partials/cookie-banner.php): Failed to open stream: Permission denied in /var/www/html/nextgr/view-circuit.php on line 713
Warning: include(): Failed opening 'partials/cookie-banner.php' for inclusion (include_path='.:/usr/share/php') in /var/www/html/nextgr/view-circuit.php on line 713