Power Supply Filtering
1. Purpose and Importance of Filtering in Power Supplies
Purpose and Importance of Filtering in Power Supplies
Power supply filtering is a critical process that ensures the stability and reliability of electronic systems by attenuating unwanted noise and ripple voltages. In an ideal DC power supply, the output voltage would be perfectly constant, but real-world power sources introduce disturbances from multiple origins:
- Rectification artifacts: AC-to-DC conversion generates ripple at multiples of the input frequency (e.g., 120 Hz in full-wave rectification of 60 Hz mains).
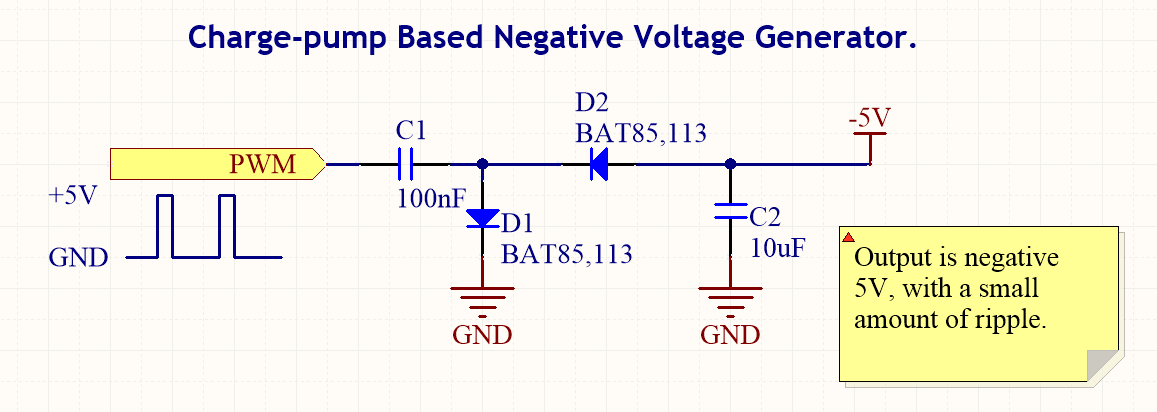
- Switching noise: Switch-mode power supplies (SMPS) produce high-frequency harmonics from their pulse-width modulation (PWM) operation.
- Load transients: Dynamic current demands from digital ICs or RF circuits create instantaneous voltage fluctuations.
- Electromagnetic interference (EMI): Coupled noise from nearby circuits or external sources.
Quantifying Filter Performance
The effectiveness of a power supply filter is characterized by its ripple rejection ratio (RRR) and output impedance. For a simple LC filter, the attenuation of ripple voltage can be derived from the voltage divider principle:
where ω is the angular frequency of the noise component. This demonstrates the second-order roll-off characteristic (40 dB/decade) of LC filters above their cutoff frequency:
Practical Design Considerations
Effective filtering requires balancing several competing factors:
- Parasitic elements: Real capacitors exhibit equivalent series resistance (ESR) and inductance (ESL), which limit high-frequency performance.
- Load regulation: Excessive filtering can increase output impedance, degrading transient response.
- Stability: Multi-stage filters may introduce phase shifts that destabilize voltage regulators.
Modern power systems often employ hybrid approaches combining passive filters with active regulation. For example, a typical high-performance supply might use:
- Bulk capacitance (electrolytic) for low-frequency ripple
- Ceramic capacitors for mid-range switching noise
- Ferrite beads or π-filters for RF suppression
- Active regulators (LDOs or switching converters) for final conditioning
Case Study: Medical Imaging Equipment
In MRI systems, power supply noise below 1 μV RMS is often required to prevent artifacts in sensitive RF receivers. This is achieved through:
- Cryogenic filtering for superconducting magnets
- Triple-shielded transformer isolation
- Distributed point-of-load regulation
1.2 Types of Noise in Power Supplies
Thermal Noise (Johnson-Nyquist Noise)
Thermal noise arises due to the random motion of charge carriers in resistive elements and is present in all conductors. Its power spectral density (PSD) is frequency-independent (white noise) and given by:
where k is Boltzmann's constant (1.38 × 10⁻²³ J/K), T is absolute temperature, R is resistance, and Δf is bandwidth. In power supplies, thermal noise becomes significant in high-impedance circuits or low-noise applications like precision instrumentation.
Shot Noise
Shot noise occurs due to discrete charge carriers crossing a potential barrier (e.g., in diodes or transistors). Its current noise spectral density is:
where q is electron charge (1.6 × 10⁻¹⁹ C) and IDC is the DC current. This noise is particularly relevant in switching regulators where diode reverse recovery and transistor switching introduce shot noise components.
Flicker Noise (1/f Noise)
Flicker noise dominates at low frequencies (<1 kHz) and follows an inverse frequency dependence:
where K is a device-specific constant and α typically ranges from 0.8 to 1.2. In power MOSFETs and bipolar transistors, flicker noise arises from traps at the silicon-oxide interface or bulk defects.
Switching Noise
In switching power supplies, high-frequency noise (10 kHz–100 MHz) is generated by:
- Diode reverse recovery
- MOSFET switching transitions
- Parasitic LC ringing
The noise amplitude depends on switching speed (dV/dt, dI/dt) and can be modeled as:
Conducted EMI
Conducted emissions propagate through power lines in two modes:
- Differential-mode noise: Current flows out and back through supply lines
- Common-mode noise: Current flows through supply lines to ground
The frequency spectrum typically shows peaks at the switching frequency and its harmonics. For a buck converter switching at fsw:
Radiated Noise
High-frequency switching creates electromagnetic fields through:
- Loop antennas (current loops in PCB traces)
- Dipole antennas (voltage gradients between components)
The radiated electric field at distance r from a current loop of area A is:
Ground Bounce
When multiple circuits share a ground plane, transient currents create voltage fluctuations (ΔI noise):
where Lgnd and Rgnd are the ground path inductance and resistance. This is critical in mixed-signal systems where digital switching noise couples into analog circuits.
Basic Filtering Components and Their Roles
Capacitors in Power Supply Filtering
Capacitors serve as the primary energy storage elements in power supply filtering, providing low-impedance paths for AC ripple while blocking DC. The impedance of an ideal capacitor is given by:
where ω is the angular frequency and C is capacitance. Practical capacitors exhibit equivalent series resistance (ESR) and equivalent series inductance (ESL), which become significant at high frequencies. Aluminum electrolytic capacitors offer high capacitance values (µF to mF range) for low-frequency ripple suppression, while ceramic capacitors (nF to µF range) handle high-frequency noise due to their low ESL.
Inductors in Filter Networks
Inductors oppose rapid current changes through their frequency-dependent impedance:
When used in LC filters, inductors form a second-order system with a roll-off of -40 dB/decade above the cutoff frequency:
Practical considerations include core saturation currents (for ferrite-core inductors) and skin effect losses (at high frequencies). Toroidal inductors minimize magnetic flux leakage compared to solenoid designs.
Resistors in RC Filters
Resistors provide damping in RC networks, controlling the quality factor (Q) of the filter. The time constant Ï„ = RC determines the cutoff frequency:
In power applications, resistors must be rated for adequate power dissipation (P = I²R). Thick-film and wirewound resistors are preferred over carbon composition types due to better thermal stability.
Ferrite Beads for High-Frequency Suppression
Ferrite beads act as frequency-dependent resistors, presenting low impedance at DC but high impedance at RF frequencies (typically 10 MHz to 1 GHz). Their complex impedance is modeled as:
The resistive component dominates above the bead's self-resonant frequency, converting noise energy into heat. Bead selection depends on the target frequency range and current rating.
Active Filter Components
Operational amplifiers enable active filtering when passive components cannot meet performance requirements. A basic Sallen-Key low-pass filter implements the transfer function:
where K is the gain. Active filters provide precise cutoff frequencies without bulky inductors, but introduce power supply rejection ratio (PSRR) constraints.
2. Capacitors in Power Supply Filtering
2.1 Capacitors in Power Supply Filtering
Fundamental Role of Capacitors
Capacitors serve as energy reservoirs in power supply circuits, smoothing voltage fluctuations by charging during peak voltage conditions and discharging during troughs. The instantaneous voltage ripple ΔV across a capacitor is governed by the charge-discharge relationship:
where Iload is the load current, Δt the discharge period, and C the capacitance. For a 100mA load with a 10μF capacitor and 8.3ms half-wave rectification period (60Hz), the ripple calculates to 83mV. Larger capacitance reduces ripple proportionally.
Frequency-Dependent Impedance
The effective impedance ZC of a capacitor at frequency f combines ESR (Equivalent Series Resistance) and reactance:
At 100kHz, a 10μF ceramic capacitor (ESR=5mΩ) exhibits 0.16Ω impedance, while an electrolytic counterpart (ESR=1Ω) shows ≈1Ω impedance. This makes ceramics superior for high-frequency noise suppression.
Parasitic Effects and Stability
Real capacitors introduce parasitic inductance (ESL), forming a resonant circuit. The self-resonant frequency (fSRF) marks the transition from capacitive to inductive behavior:
A 100nF MLCC with 1nH ESL resonates at 15.9MHz. Beyond fSRF, the capacitor loses effectiveness, necessitating parallel smaller capacitors for broadband filtering.
Practical Configurations
Multi-stage filtering often combines:
- Bulk electrolytics (100-1000μF) for low-frequency ripple
- Ceramic arrays (0.1-10μF) for mid-range noise
- Tantalum/Polymer for stable mid-frequency performance
For example, a 12V SMPS might use 220μF aluminum electrolytic (ESR=300mΩ) || 10μF X7R (ESR=5mΩ) || 100nF C0G (ESR=2mΩ) to cover 100Hz-100MHz.
Transient Response Analysis
During load steps, capacitors must supply current until the regulator responds. The required capacitance to maintain voltage within ΔVmax during a Δt transient is:
A 2A step lasting 10μs with 50mV tolerance requires ≥400μF. Real-world designs derate this by 30-50% due to temperature and aging effects.
Dielectric Material Tradeoffs
| Type | ESR (mΩ) | Temp. Stability | Voltage Coefficient |
|---|---|---|---|
| X7R Ceramic | 2-50 | ±15% (-55°C to +125°C) | -20% at 50% Vrated |
| Aluminum Electrolytic | 300-2000 | -40% to +50% (-40°C to +105°C) | N/A |
| OS-CON Polymer | 10-100 | ±5% (-55°C to +105°C) | N/A |
X7R ceramics offer low ESR but suffer capacitance loss at DC bias, while polymers balance stability and performance.
2.2 Inductors and Chokes for Noise Suppression
Fundamental Principles of Inductive Filtering
Inductors oppose rapid changes in current through Faraday's law of induction, where the induced electromotive force (EMF) is given by:
For a sinusoidal current i(t) = Ipsin(ωt), this results in a frequency-dependent impedance:
where L is inductance in henries and ω is angular frequency. This property makes inductors ideal for:
- Attenuating high-frequency noise while passing DC
- Forming LC filters with capacitors for resonant suppression
- Blocking common-mode interference in chokes
Types of Noise-Suppression Inductors
1. Differential-Mode Chokes
Single-wound inductors placed in series with power lines, effective against:
- Switching noise from DC-DC converters (10kHz-1MHz)
- Ripple currents in power supplies
2. Common-Mode Chokes
Toroidal designs with bifilar winding that cancel opposing magnetic fields for:
- EMI reduction (1MHz-1GHz)
- Ground loop mitigation
The common-mode impedance is dominated by:
where M is mutual inductance and Rw is winding resistance.
Core Material Selection
| Material | Frequency Range | μr | Applications |
|---|---|---|---|
| Ferrite | 1MHz-500MHz | 20-15,000 | Switch-mode power supplies |
| Powdered Iron | 50kHz-10MHz | 10-100 | DC-DC converters |
| Nanocrystalline | 10kHz-1MHz | 50,000+ | High-current chokes |
Practical Design Considerations
The self-resonant frequency (SRF) limits usable bandwidth:
Key tradeoffs include:
- Saturation current vs. inductance value
- Core losses (hysteresis + eddy currents) at high frequencies
- Winding capacitance affecting high-frequency performance
Advanced Topologies
For multi-stage filtering, π-filters combine inductors and capacitors:
Where the -3dB cutoff frequency occurs at:
with quality factor Q = (1/R)√(L/C). This configuration provides >60dB attenuation above cutoff when properly implemented.
2.3 Resistors and Damping Circuits
In power supply filtering, resistors play a critical role in controlling damping behavior, particularly in LC filter networks. The damping factor (ζ) determines whether the system response is underdamped, critically damped, or overdamped, directly influencing transient performance and ripple attenuation. For an RLC circuit, the damping ratio is derived from the relationship between resistance, inductance, and capacitance:
where R is the series resistance, L is the inductance, and C is the capacitance. A critically damped system (ζ = 1) provides the fastest transient response without oscillation, achieved when:
Practical Implementation
In switch-mode power supplies, damping resistors are often placed in series with filter capacitors to suppress high-frequency ringing. The optimal resistor value balances between excessive power dissipation and insufficient damping. For example, in a buck converter with L = 10 µH and C = 100 µF, the critical damping resistance calculates to:
Quality Factor and Bandwidth
The quality factor (Q) of an RLC filter is inversely proportional to damping:
For EMI filter designs, a Q < 0.5 is typically targeted to avoid peaking in the frequency response. This requires careful resistor selection, as parasitic ESR (Equivalent Series Resistance) of capacitors often contributes significantly to total damping.
Non-Ideal Effects
Real-world implementations must account for:
- Resistor parasitic inductance: Becomes significant at frequencies above 10 MHz for axial-lead resistors
- Thermal noise: Johnson-Nyquist noise (4kBTRB) limits sensitivity in low-noise applications
- Power derating: Pulse handling capability must be evaluated for switching applications
In high-current applications, current-sense resistors double as damping elements, where their TCR (Temperature Coefficient of Resistance) affects filter stability over temperature ranges. For precision circuits, metal foil resistors provide the best TCR performance (±1 ppm/°C) but at higher cost.
LC and RC Filter Configurations
LC Filters: Theory and Design
An LC filter consists of an inductor (L) and a capacitor (C) arranged to attenuate high-frequency noise while allowing DC and low-frequency signals to pass. The inductor blocks high-frequency AC components by presenting a high impedance, while the capacitor shunts them to ground. The transfer function of a second-order LC low-pass filter is derived from its impedance network:
where s is the complex frequency variable (s = jω), and R represents the load resistance. The cutoff frequency (f_c) is given by:
For practical designs, the inductor's parasitic resistance (R_L) and capacitor's equivalent series resistance (ESR) must be considered, as they introduce damping and affect the filter's quality factor (Q):
High Q filters exhibit sharper roll-off but may introduce ringing in transient responses. Critical damping (Q = 0.707) is often targeted for power supply applications to balance attenuation and stability.
RC Filters: Analysis and Limitations
An RC filter uses a resistor (R) and capacitor (C) to achieve first-order attenuation. Its transfer function is:
The cutoff frequency is:
Unlike LC filters, RC filters dissipate energy as heat in the resistor, making them less efficient for high-current applications. However, they are simpler, cheaper, and avoid the magnetic interference and saturation risks associated with inductors. The roll-off rate is −20 dB/decade, compared to −40 dB/decade for LC filters.
Comparative Performance and Applications
LC filters excel in:
- High-current power supplies (e.g., switch-mode converters), where low DC resistance minimizes voltage drop.
- Applications requiring steep attenuation (e.g., RF noise suppression).
RC filters are preferred for:
- Low-power circuits (e.g., signal conditioning, sensor interfaces).
- Cost-sensitive designs where inductors are prohibitive.
A combined LCL or CLC topology can achieve higher-order filtering with intermediate impedance matching, often used in EMI suppression for industrial equipment.
Practical Design Considerations
For LC filters:
- Select inductors with a saturation current rating exceeding the maximum load current.
- Use multilayer ceramic capacitors (MLCCs) for low ESR at high frequencies.
For RC filters:
- Ensure the resistor's power rating accommodates I²R losses.
- Bypass electrolytic capacitors with a small ceramic capacitor to mitigate ESR effects at higher frequencies.
Simulation tools like SPICE can model parasitics (e.g., PCB trace inductance) that impact performance beyond ideal calculations.
3. Voltage Regulators as Active Filters
3.1 Voltage Regulators as Active Filters
Voltage regulators, traditionally used for maintaining a stable DC output, exhibit inherent filtering properties that make them effective as active filters. Unlike passive LC or RC filters, regulators actively suppress input ripple and noise through feedback control, offering superior line and load regulation while attenuating disturbances.
Mechanism of Ripple Rejection
The ripple rejection capability of a voltage regulator is quantified by its power supply rejection ratio (PSRR), defined as:
For a linear regulator like the LM317, PSRR typically exceeds 60 dB at 120 Hz, decaying at approximately -20 dB/decade with frequency. This behavior arises from the regulator's error amplifier, which compares a fraction of the output voltage to a reference and adjusts the pass element to cancel input variations.
Dynamic Response and Stability
The closed-loop transfer function of a regulator reveals its filtering characteristics. For a generic linear regulator with dominant-pole compensation:
where A0 is the DC gain (often >80 dB) and ωp is the pole frequency (typically 1-10 Hz). The resulting bandwidth limitation attenuates high-frequency noise while maintaining low output impedance.
Practical Implementation Considerations
- Bypass capacitors: Critical for stability, with values chosen based on the regulator's compensation network. For example, low-ESR 10 μF ceramic capacitors are often specified for modern LDOs.
- Dropout voltage: Impacts filtering effectiveness, as insufficient headroom reduces PSRR. Switching regulators require additional post-regulation for sensitive applications.
- Thermal design: Dissipation in the pass transistor affects long-term reliability, particularly when handling large input ripple voltages.
Case Study: LT3045 Ultra-Low Noise Regulator
This regulator achieves 79 dB PSRR at 1 MHz through a patented paralleled NMOS architecture and precision bandgap reference. Its noise spectral density of 2 nV/√Hz demonstrates how advanced topologies push active filtering performance beyond passive solutions.
Comparative Analysis: Linear vs. Switching Regulators
| Parameter | Linear Regulator | Switching Regulator |
|---|---|---|
| PSRR at 100 kHz | 40-60 dB | 20-40 dB |
| Noise Floor | μV-range | mV-range |
| Efficiency | 30-60% | 80-95% |
3.2 Operational Amplifier-Based Filters
Operational amplifiers (op-amps) enable the design of highly precise active filters with well-defined frequency responses, overcoming the limitations of passive RC and LC networks. These filters leverage the op-amp's high input impedance, low output impedance, and open-loop gain to implement transfer functions with minimal loading effects and adjustable parameters.
First-Order Active Filters
The simplest op-amp-based filter is the first-order active low-pass filter, consisting of an RC network followed by a non-inverting amplifier. The transfer function is derived from the voltage divider rule and the op-amp's gain:
where Rf and Ri set the DC gain, while R and C determine the cutoff frequency (fc = 1/(2Ï€RC)). A high-pass variant swaps the resistor and capacitor positions in the feedback network.
Sallen-Key Topology
Second-order filters improve roll-off steepness and are commonly implemented using the Sallen-Key configuration. The generic transfer function for a low-pass Sallen-Key filter is:
where:
- K is the passband gain (set by R3 and R4),
- ω0 is the natural frequency,
- Q is the quality factor, adjustable via resistor ratios.
The component values for a Butterworth response (Q = 0.707) are typically selected such that:
Multiple Feedback (MFB) Filters
For applications requiring inverting gain or higher Q values, the multiple feedback (MFB) topology is preferred. Its transfer function for a bandpass implementation is:
MFB filters excel in stability for high-Q designs but require careful component selection to avoid excessive sensitivity to tolerances.
State-Variable Filters
For independently tunable parameters, state-variable filters use multiple op-amps to provide simultaneous low-pass, high-pass, and band-pass outputs. The architecture consists of two integrators and a summing amplifier, enabling precise control over fc and Q without cross-coupling effects.
This topology is prevalent in audio equalizers and biomedical instrumentation.
Practical Considerations
Op-amp selection critically impacts filter performance:
- Gain-bandwidth product (GBW) must exceed fc × |H(fc)| to avoid attenuation.
- Slew rate limits the maximum undistorted output swing at high frequencies.
- Noise density contributes to the signal-to-noise ratio, particularly in low-frequency applications.
For example, a 10 kHz Butterworth filter with 20 dB gain requires an op-amp with GBW > 200 kHz. Precision resistors (0.1% tolerance) and NP0/C0G capacitors minimize passband ripple.
Switching Regulator Noise Mitigation
Sources of Switching Noise
Switching regulators introduce high-frequency noise due to rapid transitions in current and voltage. The primary contributors are:
- Diode reverse recovery in non-synchronous designs, causing ringing at switch transitions.
- Parasitic inductance and capacitance in PCB traces and component packages, forming resonant tanks.
- Pulse-width modulation (PWM) harmonics extending into the hundreds of MHz range.
Input Filter Design
Effective input filtering requires addressing both differential-mode (DM) and common-mode (CM) noise. The cutoff frequency should be at least one decade below the switching frequency (fSW):
For a buck converter switching at 500 kHz, a second-order LC filter with Lfilter = 10 µH and Cfilter = 10 µF yields:
Output Stage Optimization
Minimizing output ripple requires careful selection of capacitors based on their impedance characteristics:
- Ceramic capacitors (X7R, C0G) provide low ESL for high-frequency bypass.
- Electrolytic/Tantalum capacitors handle bulk energy storage with higher ESR.
The total output impedance (Zout) must satisfy:
where Ipp is the peak-to-peak inductor current.
Layout Techniques
Critical practices for noise reduction include:
- Minimizing loop areas for high di/dt paths (switch node, input caps).
- Using ground planes with strategic splits to separate analog and power domains.
- Placing feedback networks away from noisy traces with guard traces if needed.
Advanced Techniques
For ultra-low noise applications:
- Spread-spectrum modulation dithers fSW to reduce peak emissions.
- Active cancellation injects anti-phase noise via auxiliary circuits.
- GaN FETs reduce switching losses and associated ringing compared to silicon MOSFETs.
Measurement and Validation
Characterize noise using:
- 50 Ω coaxial connections to a spectrum analyzer (DC-blocked for AC measurements).
- High-bandwidth differential probes for time-domain analysis of switching edges.
- Impedance analyzers to verify capacitor network performance up to 100 MHz.
4. PCB Layout Techniques for Effective Filtering
4.1 PCB Layout Techniques for Effective Filtering
Minimizing Inductive Loops in Power Distribution
Parasitic inductance in power traces introduces high-frequency impedance, degrading transient response and increasing noise. The loop inductance L of a trace can be approximated by:
where l is trace length, w is width, t is thickness, and μr is the relative permeability of the substrate. To minimize inductance:
- Place power and ground planes adjacent in the layer stackup, separated by a thin dielectric (< 4 mil).
- Route critical power traces as wide as possible, with ground return paths directly underneath.
- Use multiple vias for parallel current paths in high-current applications.
Capacitor Placement Strategies
The effectiveness of decoupling capacitors depends on their proximity to the load. The total impedance Ztot seen by the IC includes trace inductance:
Optimal placement follows these guidelines:
- Place bulk capacitors (>10μF) near voltage regulators.
- Position ceramic decoupling capacitors (100nF-1μF) within 3mm of IC power pins.
- Use small-form-factor packages (0402 or 0201) for >100MHz decoupling to reduce parasitic inductance.
Ground Plane Partitioning
Mixed-signal systems require careful ground management to prevent noise coupling. The critical frequency fc where return currents start spreading in the ground plane is:
where t is plane thickness and d is the separation between digital and analog sections. Implementation strategies include:
- Use a unified ground plane below 1MHz, split planes above 10MHz.
- Route sensitive analog traces over continuous ground areas.
- Connect split planes at a single point near the power entry.
Transmission Line Effects in Power Distribution
At frequencies where trace length exceeds λ/10, transmission line effects dominate. The characteristic impedance Z0 of power-ground plane pairs is:
where h is dielectric thickness and w is plane width. Mitigation techniques:
- Implement distributed capacitance with interdigitated plane geometries.
- Use buried capacitance materials (2-4μm dielectric) for GHz-range filtering.
- Stagger resonant frequencies by mixing capacitor values (e.g., 0.1μF, 1nF, 10pF).
Via Optimization for High-Frequency Decoupling
Via inductance becomes significant above 100MHz. The inductance of a via barrel is approximately:
where h is via length and d is diameter. Best practices include:
- Use multiple vias in parallel for high-current paths (reduces inductance as 1/n).
- Place vias immediately adjacent to capacitor pads (avoid stub traces).
- Consider microvias (≤4mil diameter) for RF applications.
4.2 Component Selection and Sizing
Effective power supply filtering hinges on precise component selection and sizing to mitigate ripple, noise, and transient responses. The critical components—capacitors, inductors, and resistors—must be chosen based on electrical characteristics, thermal constraints, and application-specific requirements.
Capacitor Selection
The primary function of a filter capacitor is to provide low-impedance paths for AC ripple while maintaining DC stability. The capacitance value C is derived from the allowable ripple voltage ΔV, load current IL, and ripple frequency fripple:
For example, a 1A load with 100mV ripple tolerance at 120Hz (full-wave rectified) requires:
Electrolytic capacitors are typical for bulk filtering due to high capacitance density, but their equivalent series resistance (ESR) and inductance (ESL) must be minimized. Ceramic or film capacitors are often placed in parallel to suppress high-frequency noise.
Inductor Sizing for LC Filters
Inductors in LC filters block high-frequency noise while allowing DC to pass. The cutoff frequency fc of an LC filter is:
To achieve a cutoff at 10kHz with a 100µF capacitor, the inductor must satisfy:
Core saturation current and DC resistance (DCR) are critical parameters. Ferrite cores are preferred for high-frequency applications, while powdered iron cores suit high-current scenarios.
Resistor-Capacitor (RC) Filter Design
RC filters are simpler but less efficient for high-current applications. The time constant Ï„ = RC determines the roll-off frequency:
Power dissipation in the resistor (P = I2R) must be accounted for to avoid thermal runaway. For a 100mA load and 10Ω resistor, the power dissipation is 100mW, necessitating at least a 0.25W resistor for derating.
Parasitic Effects and Mitigation
Parasitic elements degrade filter performance:
- Capacitor ESR: Causes voltage drop and self-heating. Low-ESR types (e.g., polymer electrolytics) are essential for high-ripple-current applications.
- Inductor Parasitic Capacitance: Creates self-resonant frequencies (SRF), limiting high-frequency effectiveness.
- PCB Layout Impedances: Trace inductance and capacitance can bypass filter components at RF frequencies.
Simulation tools like SPICE or finite-element analysis (FEA) help validate designs against parasitics before prototyping.
Thermal and Reliability Considerations
Component derating ensures longevity under operational stress:
- Capacitors should operate below 80% of rated voltage and 85°C.
- Inductors must stay below core saturation current and temperature limits.
- Resistors should dissipate ≤50% of rated power in high-reliability designs.
4.3 Measuring and Testing Filter Performance
Time-Domain Analysis
Transient response analysis provides critical insights into filter behavior under dynamic conditions. A step or impulse input reveals settling time, overshoot, and ringing, which correlate with the filter's damping factor and pole-zero distribution. For a second-order low-pass filter with a transfer function:
The step response y(t) is derived via inverse Laplace transform:
where ζ is the damping ratio and ωn is the natural frequency. Oscilloscope measurements should match this theoretical response within component tolerances.
Frequency-Domain Characterization
Network analyzers or swept-frequency measurements quantify insertion loss and phase response. Key metrics include:
- -3 dB bandwidth: Frequency where output power drops to 50% of passband value
- Stopband attenuation: Minimum rejection ratio in dB at specified frequencies
- Group delay: Derivative of phase response dϕ/dω, indicating signal dispersion
For a multi-stage LC filter, the composite response follows from cascaded S-parameter matrices:
Noise and Ripple Measurements
Power supply filters must minimize output noise while maintaining regulation. Use a spectrum analyzer with these techniques:
- Band-limited RMS measurement: Integrates noise density over relevant bandwidth
- Peak-to-peak ripple: Captures worst-case transient deviations
- PSRR testing: Injects AC disturbance on DC input while monitoring output
The noise spectral density Svv(f) relates to filter components through:
where k is Boltzmann's constant, T is temperature, and K represents dielectric noise coefficients.
Impedance Analysis
Frequency-dependent impedance profoundly affects filter stability, particularly in switched-mode supplies. Vector network analyzers measure:
- Output impedance (Zout): Must remain below load impedance across frequency
- Input impedance (Zin): Impacts source interaction and EMI filter effectiveness
The impedance profile of a π-filter can be modeled as:
Real-World Validation
Field testing under operational conditions exposes non-ideal behaviors:
- Thermal drift: Capacitor ESR increases with temperature, reducing filter Q-factor
- Nonlinear effects: Ferrite cores exhibit permeability variations with flux density
- Transient loading: Step changes in current demand may excite filter resonances
For mission-critical applications, perform accelerated lifetime testing with:
where λ terms represent failure rates of individual components.
5. Recommended Books and Publications
5.1 Recommended Books and Publications
- PDF Power Electronics and Electric Drives - download.e-bookshelf.de — 5.5 Railway power supply system 276 5.6 ESSs for railway applications 278 5.7 Ground level power supply systems 332 5.8 Auxiliary power systems for railway applications 338 5.9 Real examples 340 5.10 Historical evolution 351 5.11 New trends and future challenges 351 References 357 6 Ships 362 Iñigo Atutxa and Gonzalo Abad 6.1 Introduction 362
- Handbook of Power Systems Engineering with Power Electronics Applications — Rev. ed. of: Handbook of power system engineering. ISBN: 978-1-119-95284-8 (cloth) 1. Electric power systems. I. Hase, Yoshihide, 1937- Handbook of power system engineering. II. Title. TK3001.H63 2013 621.319-dc23 2012023513 A catalogue record for this book is available from the British Library. Print ISBN: 9781119952848
- PDF Conducted Emissions and Power Supply Filters - IEEE Web Hosting — 10 5 1 k 1.2 F 8 F 0.25 F ... • Power supply filtering can determine the ability to meet CE requirements. Title: Conducted Emissions and Power Supply Filters Mark A. Steffka email: [email protected] Telephone: 1-248-255-7441 Created Date: 1/18/2011 8:25:42 AM ...
- A comprehensive review of improving power quality using active power ... — To achieve new energy consumption, efficient utilization and flexible control of electric energy, power electronics technology has been widely used in power system generation, transmission, distribution, storage and other fields, which makes the power system be a power electronic based power system [1, 2]. Power electronic devices are non ...
- FUNDAMENTALS OF ELECTRIC POWER ENGINEERING - Wiley Online Library — ELECTRIC POWER ENGINEERING From Electromagnetics to Power Systems MASSIMO CERAOLO ... Limit of Liability/Disclaimer of Warranty: While the publisher and author have used their best efforts in preparing this book, they make no representations or warranties with respect to the accuracy or ... 8.5 Filtering Basics, 283 8.5.1 The Basic Principle, 283
- Power Quality in Modern Power Systems - ResearchGate — In accordance with (10), taking into account (13), (14), we obtain that the shunt reactor consumes reactive power from the power supply network at the main harmonic: Fig. 3 shows the dependence ...
- PDF Another EMC resource from EMC Standards — (a) a line filter made by reo, (b) best location for such a filter to be effective 55 figure 42 as can be seen, the wring inside this cabinet was a mess, with flying wires over the pcb, especially over the filter area 56 figure 43 demonstration of a flying wire over a power supply unit, noise was induced into the coaxial cable and
- Active Power Filters - ScienceDirect — (41.62) shows that if β > 0, the active power filter generates a voltage at fundamental frequency in phase with V T, reducing the reactive power that flows to the load. If β < 0, the active power filter generates a voltage at fundamental frequency phase shifted by 180 degrees with respect to V T, increasing the reactive power that flows to ...
- Power Converters with Digital Filter Feedback Control — Power Converter with Digital Filter Feedback Control presents a logical sequence that leads to the identification, extraction, formulation, conversion, and implementation for the control function needed in electrical power equipment systems.. This book builds a bridge for moving a power converter with conventional analog feedback to one with modern digital filter control and enlists the state ...
- IEEE Recommended Practices and Requirements for Harmonic Control in ... — A type of filter that reduces harmonics by putting a high series impedance between the harmonic source and the system to be protected. Traditionally, the current wave shape is used as the basis for harmonic analysis, and voltage notching is calculated from the I.2 drops of the current harmonics.
5.2 Online Resources and Tutorials
- PDF Filtering Techniques: Isolating Analog and Digital Power Supplies in TI ... — Filtering Techniques: Isolating Analog and Digital Power Supplies in TI's PLL-Based CDC Devices 3 Example Let us assume that: (1) we have a board of 50 gates (output buffers) each switching a 15-pF load in 2.4 ns, (2) a power supply wiring inductance of L = 110 nH, (3) a power supply of VCC = 3.3 V, and (4) a 120-mV noise margin (Vn =120mV).
- PDF Conducted Emissions and Power Supply Filters - IEEE Web Hosting — Types of Power Supplies • Two (2) types of power supplies in use today. - Linear - Switch Mode Power Supply (SMPS) • Each type has characteristic that can impact EMC performance. - Linear power supplies are inherently quieter with regard to EMC emissions due to the method used to generate the output power. - Switching power supplies ...
- PDF SEC1205 - ELECTRONIC CIRCUITS - I - Sathyabama Institute of Science and ... — SEC1205 - ELECTRONIC CIRCUITS - I UNIT I RECTIFIERS AND POWER SUPPLIES Half Wave Rectifier - Full Wave Rectifier - Bridge Rectifier - Performance of Rectifiers - Filters - Types of Filters - L, C, LC, π Filters - Ripple Factor Calculation for C, L, LC and π Filter - Regulators - Shunt and Series Voltage Regulator - IC Regulator - SMPS.
- PDF Power Supplies and Linear Regulators - University of Kansas — power supply filter (32.5 V, in this case) must be less that the op-amp's maximum supply voltage rating. For the LM741C this value is 36 V. For the LM318 this value is 40 V. So either of these devices will meet this part of the requirement. Let's select the LM741C. The next question is: Is the minimum DC output from the power supply
- Output Noise Filtering for DC/DC Power Modules - Texas Instruments — Output Noise Filtering for DC/DC Power Modules 3 Filtering Design and Implementation 3.1 LC Filter Certain applications, such as test and measurement, are sensitive to output voltage ripple and routinely require low output voltage ripple. Designing a second stage filter starts with first understanding what noise needs to be attenuated.
- PDF Chapter 5 : FILTERS — ANALOG ELECTRONICS BİLKENT UNIVERSITY where ωc is the 3-dB cut-off frequency, n is the number of elements (capacitors and inductors), PL is the power delivered to load and PA is the available power at the source. PL/PA is plotted versus frequency for different number of elements, n, in Figure 5.5. As n increases the power transfer function approaches to an ideal LPF.
- PDF Chapter L harmonic filtering — Schneider Electric - Electrical installation guide 2007 L - Power factor correction and harmonic filtering L3 .3 The power factor Definition of power factor The power factor of a load, which may be a single power-consuming item, or a number of items (for example an entire installation), is given by the ratio of P/S i.e.
- Chapter 37: Filtered and Regulated Power Supplies — The simple capacitor filter is the most basic type of power supply filter. The application of the simple capacitor filter is very limited. It is sometimes used on extremely high-voltage, low-current power supplies for cathode-ray and similar electron tubes, which require very little load current from the supply.
- PDF PHYSICS 536 DC Power Supply I. - Purdue University — four parts: a transformer, full-wave bridge rectifier, capacitor filter, and regulator. A zener diode regulator is also included as a simple illustration of regulator properties. 1. Transformer . A transformer is used to obtain the approximate output voltage of the power supply. The output of the transformer is still AC. 2. Rectification
- PDF Active Filter Design Techniques - School of Engineering & Applied Science — nal conditioning stages. System power supplies often use band-rejection filters to sup-press the 60-Hz line frequency and high frequency transients. In addition, there are filters that do not filter any frequencies of a complex input signal, but just add a linear phase shift to each frequency component, thus contributing to a constant time delay.
5.3 Datasheets and Application Notes
- PDF AN2586 Application note - STMicroelectronics — is used to supply the internal 1.8 V digital power. The real-time clock (RTC) and backup registers can be powered from the V BAT voltage when the main VDD supply is powered off. Figure 1. Power supply overview Note: VDDA and VSSA must be connected, respectively, to VDD and VSS. 2.1.1 Independent A/D converter supply and reference voltage
- PDF Application Manual for Power Supply Noise Suppression and Decoupling ... — 7. Location of a capacitor for suppressing power supply impedance 56 7.1 Power supply impedance relative to an IC 56 7.2 Simple estimation of power supply impedance relative to an IC 57 7.3 Possible range for placing the closest capacitor of an IC 58 7.4 Guideline for the maximum allowable wiring length, l max 60 8.
- PDF 8 Outputs VDD CLK0 Power Supply Filtering OEA VDDO ... - Mouser Electronics — The device supports on-chip supply voltage regulation to reject power supply noise and simplify low-jitter operation in real-world envi-ronments. This feature enables robust operation alongside FPGAs, ASICs and SoCs and may reduce board-level filtering requirements. See "AN491: Power Supply Rejection for Low-Jitter Clocks" for more information.
- PDF EMC filters 3-line filters for converters and power electronics ... — voltages at the filter are exceeded, the filter may be damaged or destroyed. Voltage derating, 9.8 Current derating at elevated ambient temperatures Non-observance of the current derating may lead to overheating and consequently represents a fire hazard. Current derating, 10.1 3-line filters B84143A*R105 for converters and power electronics
- PDF Filtering Techniques: Isolating Analog and Digital Power Supplies in TI ... — This application note recommends power supply and ground noise-reduction techniques through the use of bypass capacitors and ferrite beads in TI's PLL-based clock distribution circuits (CDC) devices. This application note also includes a numeric example, calculating the value of bypass and filter capacitors for a particular frequency of interest.
- PDF SEC1205 - ELECTRONIC CIRCUITS - I - Sathyabama Institute of Science and ... — SEC1205 - ELECTRONIC CIRCUITS - I UNIT I RECTIFIERS AND POWER SUPPLIES Half Wave Rectifier - Full Wave Rectifier - Bridge Rectifier - Performance of Rectifiers - Filters - Types of Filters - L, C, LC, π Filters - Ripple Factor Calculation for C, L, LC and π Filter - Regulators - Shunt and Series Voltage Regulator - IC Regulator - SMPS.
- PDF TOPSwitch Power Supply Design Techniques for EMI and Safety - EMC FastPass — part of the power supply/EMI filter design and is difficult to discuss as a separate issue. Throughout this application note, design guidance will also be presented for meeting safety requirements in TOPSwitch power supplies. EMI Specifications The applicable EMI specification must be identified for the intended product family and target market.
- PDF Input Filter Design for Switching Power Supplies - Texas Instruments — reaching the power line and affecting other equipment. The second purpose of the input filter is to prevent high frequency voltage on the power line from passing through the output of the power supply. A passive L-C filter solution has the characteristic to achieve both filtering requirements. The goal for the input filter design should be to ...
- TI POWER-SUPPLY FILTER ICs - Texas Instruments — passive filters in power-supply systems. By acting as a capacitance amplifier, the active EMI filter (AEF) integrated circuits (ICs) in our new power-supply filter IC portfolio make it possible to achieve up to 30 dB of additional EMI attenuation, reducing the inductance value of chokes in common-mode filters as much as 80%.
- PDF Power Supply Filters and Regulators - IDC-Online — Power Supply Filters and Regulators: We know that a pulsating dc wave is the output of the rectifier circuit. Our ultimate aim is to obtain a constant dc output. In order to obtain the constant dc output, we need to filter out the oscillations from the pulsating dc wave. with the help of a diode capacitor combination, this can be achieved.