
Water Flow Gauge using Arduino
The flow measurement system described integrates a Hall-effect sensor that detects the flow of liquid by generating a pulse output proportional to the flow rate. This sensor operates by detecting changes in a magnetic field caused by the movement of a rotor or turbine within the flow path. The generated pulses are then counted and processed by a microcontroller, which calculates both the instantaneous flow rate and the cumulative volume of the resource consumed.
To implement this system, the microcontroller is programmed to read the pulse output from the Hall-effect sensor at regular intervals. By counting the number of pulses within a defined time frame, the microcontroller can compute the instantaneous flow rate in units such as liters per minute or gallons per hour. The cumulative volume is tracked by incrementing a counter with each pulse received, allowing for accurate total consumption measurements over extended periods.
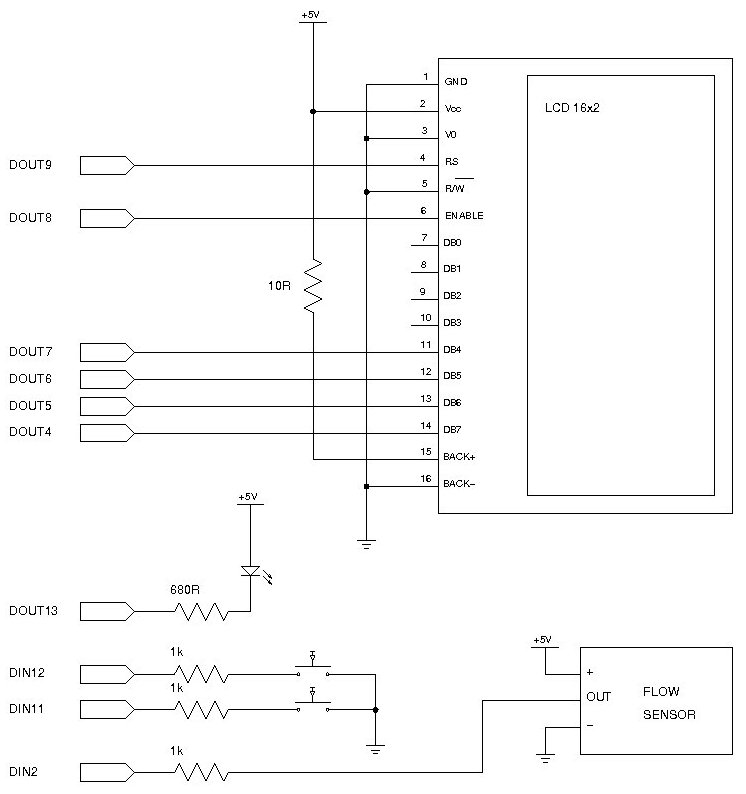
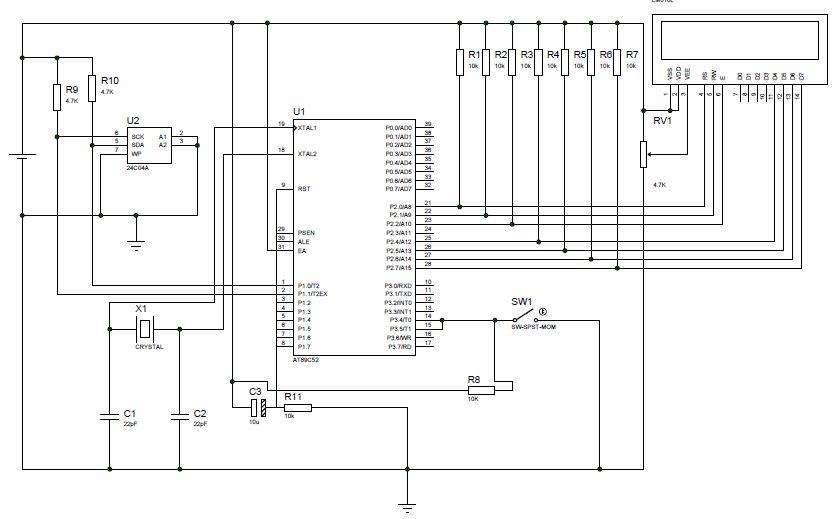
The inclusion of an LCD module provides a user-friendly interface for displaying real-time data. The microcontroller is programmed to update the LCD with the current flow rate and cumulative volume, ensuring that users can easily monitor resource consumption. Additionally, the serial connection allows for data transmission to external devices, enabling more comprehensive data logging and analysis.
The two pushbuttons serve a dual purpose: one button resets the cumulative volume counter, allowing users to measure specific events, while the other can maintain a continuous count for long-term monitoring. This design enables flexibility in usage scenarios, catering to both short-term and long-term measurement needs.
Overall, this flow measurement system exemplifies effective resource monitoring and demonstrates the application of electronic components in measuring and displaying flow rates and cumulative volumes in practical settings.Measuring the consumption of a resource that has units by volume can be more tricky than it sounds. Use of resources such as water, gas, and even electricity is typically measured by gauges that determine either instantaneous flow rate or cumulative volume over time. Both techniques have problems: measuring flow rate at frequent intervals allows y ou to do time-based reporting and generate a graph of how the flow rate varied over time, but to determine the total consumption by volume across a specific time period you then have to integrate the data and there is the danger of under-reporting usage if your sample rate is slow and usage rapidly fluctuates or spikes. Measuring cumulative volume makes it easy to determine total consumption across a period and is accurate in terms of total usage but to generate a flow rate graph you then need to calculate the difference between each sample, and if your recording interval isn`t brief enough any short-term spikes in usage will be averaged out across the recording interval and may not show clearly on the graph.
Flow gauges typically output a series of pulses proportional to the instantaneous flow rate which means that to interpret them it`s necessary to implement a simple frequency counter. This is actually the same way many car speedometers work: a wheel sensor outputs a pulse for each rotation of a wheel which means the pulse frequency varies proportionally to the vehicle speed.
The speedo then displays a scaled version of the current pulse frequency to show instantaneous speed while the odometer displays a scaled cumulative pulse count to show distance traveled both pieces of information are based on the same underlying data but they are recorded and displayed in different ways. This project uses a flow rate gauge containing a Hall-effect sensor that outputs a pulse rate proportional to flow rate, so not only is it a useful project in its own right but it also demonstrates a very useful technique that you can use in a wide range of projects that need to measure the rate at which something happens.
We`ve also included an LCD module so that the unit can report flow rate and volume both via the serial connection to a connected host and also directly via the LCD. The example program calculates and displays current flow rate, and also maintains two cumulative counters of the volume that has flowed through the sensor.
Two pushbuttons allow you to reset the counters independently so you can leave one counter running as a long-term accumulator and reset the other one occasionally prior to measure short-term events, such as the water consumed by filling a bath, running an irrigation system, or running a washing machine. 🔗 External reference
Related Circuits
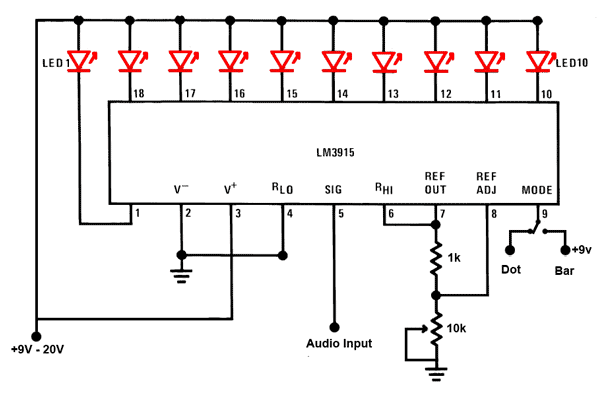
This is a simple audio sound level LED display circuit diagram. The circuit is entirely based on a single integrated circuit, the LM3915 from National Semiconductor. The LM3915 is a monolithic integrated circuit that displays the audio sound level...
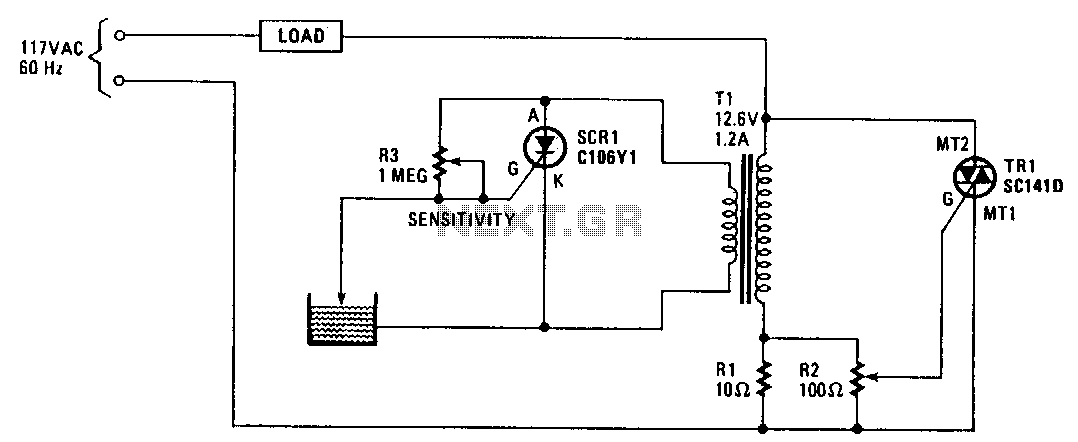
When the water level is low, the probe is out of the water, causing SCR1 to be triggered. This results in the SCR conducting and imposing a significant load on the secondary winding of transformer T1. This load is...

The micro ampere meter presented here functions as a DC millivolt meter. It achieves full-scale deflection with a 0.1V input. The current to be measured flows through a known resistance R, and the voltage drop across this resistance is...
This simple device checks if there is water in a pot plant. You stick the two probes (paperclips) into the pot plant and if the LED lights, it means there is water in the pot plant. The described device operates...
This project involves creating a digital speedometer and odometer using the AT89S52 microcontroller. Testing has been conducted using the Proteus (ISIS) simulator, and the design is functioning correctly. The digital speedometer and odometer project utilizes the AT89S52 microcontroller, which is...
Power an RS232-TTL converter circuit using the serial port to eliminate the need for an external power supply. It has been noted that the DTR, RTS, and TD pins can facilitate this. Since the TD pin is already utilized...