
monitoring electricity usage at home

The described circuit is designed to monitor electricity consumption by counting the blinks of an LED on a utility meter, which indicates energy usage. The primary components include a photoresistor (R3) that detects the LED's blinking, an ATtiny2313 microcontroller that processes the input signal, and a variable resistor (R5) that adjusts the sensitivity of the photoresistor. The microcontroller is programmed to interpret two commands: one for counting the blinks to calculate energy consumption and another for measuring the time interval between blinks to estimate current consumption.
The communication between the device and the server is facilitated by an XBee module, which transmits the data wirelessly to avoid the need for physical cabling. This setup is particularly useful given the meter's location in a utility room that is not easily accessible. Future plans involve replacing the XBee with a WLAN transmitter, which will allow for a more streamlined and efficient design.
The server-side implementation consists of two Python scripts. The first script, measurer.py, is responsible for periodic data collection and logging. It queries the device at five-minute intervals and records the electricity consumption alongside temperature data from an external source. This data is stored in an SQLite database for further analysis. The second script, show_graph.py, generates visual representations of the collected data, allowing users to analyze trends in electricity usage and temperature over specified time periods.
Overall, this project integrates both hardware and software components to create a comprehensive system for monitoring and analyzing electricity consumption in a residential setting, with an emphasis on understanding the impact of specific appliances, such as a fireplace, on overall energy usage.Gather statistic about the electricity usage at my new house, mainly to see how much using the fireplace lowers the bill. The meter installed by the utility company has a led that blinks at the speed that is relative to the usage.
Text on the meter says that 480 blinks equals 1 kWh used. I thought that building a device that keeps count of these blinks should be easy enough to make. I used photoresistor attachedv on top of the led with blu-tack. This way the measuring circuit is isolated from the mains and the setup doesn`t require tampering with the meter. The led on the meter is not very bright, so the circuit is quite sensitive to ambient light, but works reliably when the cabinet enclosing the meter is kept closed.
Currently I`m using XBee to communicate with the server which gathers the measurements. The meter itself is at the utility room, which is too far to run cables to. I`ve already bought XBee pinout compatible wlan transmitter to get rid of the XBee eventually. In the circuit, analog part on the left turns value of photoresistor (R3) to digital signal read by ATtiny2313. Sensitivity of the photoresistor is changed with the variable resistor R5. The avr responds to two commands (in current code "LUKU" and "VALI" translation would be "COUNT" and "INTERVAL").
Count simply returns number of blinks since the last count command. When read periodically, electricity usage can be calculated from the number of blinks and the time used to count them. Second command returns the time between two last blinks, so current consumption can be calculated from that.
I`d like to show the picture of the setup, but currently I`m using circuit boards from the past projects, one has the avr and the other contains the XBee, so the setup is quite messy. I`ll create custom PCB as soon as I get the wlan transmitter working. The attached AVR code is also quite messy and currently compiles to ATmega8. It could be easily ported to ex. Arduino if needed. The server part consists of two scripts. Measurer. py runs constantly and queries the device every 5 minutes and records the consumption to sqlite database together with temperature, which is parsed from the web page provided by local university.
It also provides unix socket for the second script to query current consumption and temperature. The second script, show_graph. py is meant to be run by web server. It returns graph about the usage and the temperature as png picture. Cgi parameters (to, from, interval) can be used to get graph about specific time period. Interval is used to set time in minutes for how long period of measurements are averaged. I`ve found it useful in winter time to average measurements for at least an hour, because on shorter periods consumption varies greatly based on how many heaters are running at the time. The variance makes it hard to understand what is going on and to compare the usage. 🔗 External reference
Related Circuits
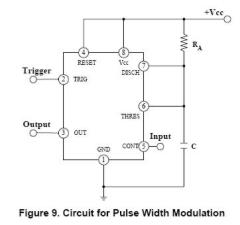
The circuit is effective for controlling the power supplied to devices such as fans, LEDs, or transformers and coils. By adjusting the pulse width, it is possible to control the speed of a fan without compromising torque. The IRF740...
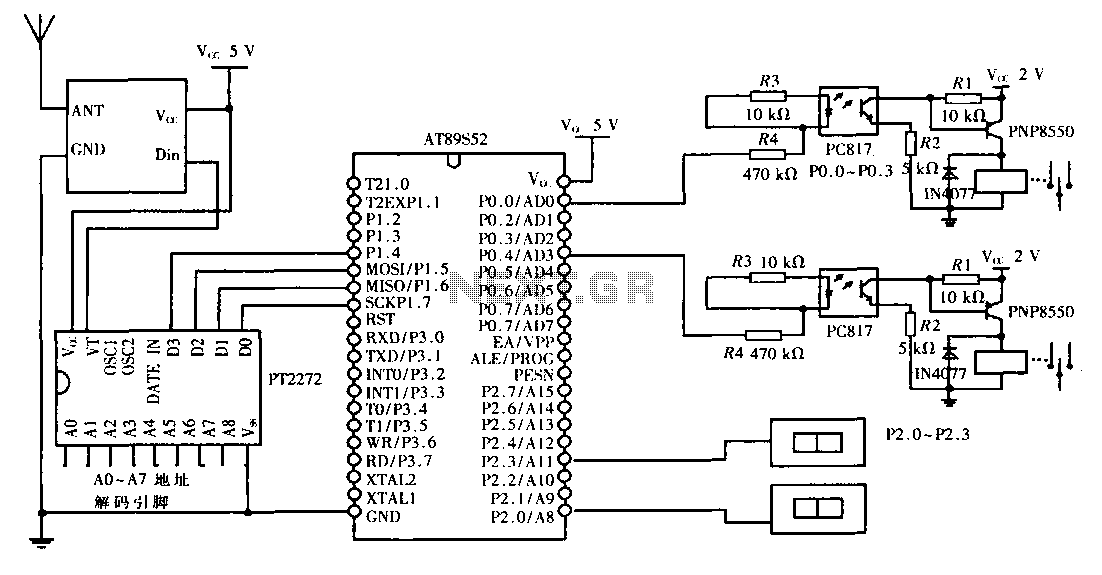
This design aims to create a long-distance wireless remote control switch lighting control system, which consists of a transmission system and a reception system. The system utilizes wireless transceiver modules for RF transmission and reception. The transmitting portion mainly...

The Pulsed Multiple Gas (PMG) laser discussed in this chapter closely resembles the Home-Built Pulsed Argon and/or Krypton (Ar/Kr) Ion Laser from Scientific American. However, the PMG laser's developers have also utilized xenon (Xe) and oxygen (O2) and even...
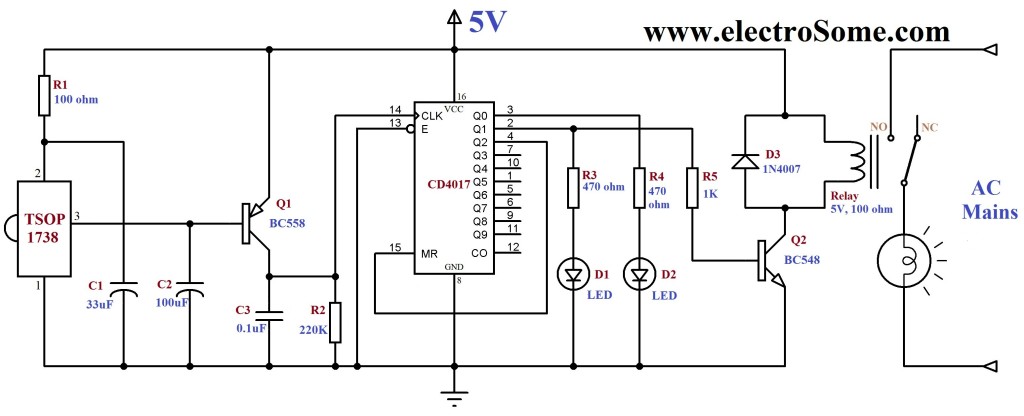
An infrared (IR) remote control circuit for managing home appliances can be constructed using a Decade Counter CD4017, a 555 Timer, and a TSOP1738 infrared receiver. This circuit allows users to control home devices with a standard remote control,...
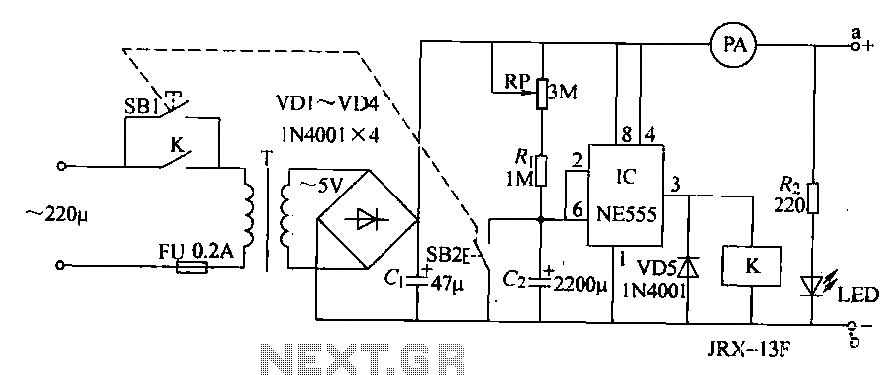
The homemade disinfectant circuit described in this example utilizes an electrolytic salt solution method to produce sodium hypochlorite (NaCl), which can be used for disinfecting living supplies for students. The circuit consists of a power circuit and a timing...
.jpg)
This article contains an assembly language listing that requires MAC/65 or the Atari Assembler Editor, along with access to an EPROM burner. The previous three installments were published in the January, February, and March 1985 issues of Antic. This...