
The E-meter
The Wien Bridge oscillator circuit is a classic example of a feedback oscillator that utilizes the balance of resistive and capacitive elements to generate a stable sine wave output. In this configuration, the op-amps are arranged to provide both gain and the necessary phase shift to sustain oscillation. The virtual ground, generated by U1A, is crucial for simplifying the power supply requirements, allowing the circuit to operate effectively with a single supply voltage. The precise adjustment of the gain through the potentiometer connected to U1B is fundamental in achieving the desired amplitude of oscillation, which is critical for accurate E-meter readings.
The integration of the oscilloscope into the measurement setup allows for real-time monitoring of the oscillation frequency and waveform shape. By storing multiple cycles of the waveform, the user can analyze the frequency response with improved accuracy. The calibration process, involving precise resistor values, ensures that the E-meter provides consistent and reliable readings across different subjects, accounting for variations in resistance that may affect the overall performance.
The use of ferrite toroids in the E-meter circuit serves to mitigate potential interference from external RF signals, which could otherwise distort the readings. The design choices made in this circuit reflect a careful consideration of both the electronic principles involved and the practical requirements of the measurement process. The attention to detail in component selection and circuit configuration underscores the importance of precision in electronic measurements, particularly in sensitive applications such as those involving the E-meter.To measure the frequency response of the e-meter, a Wein Bridge oscillator, oscilloscope, and single-ended power supply were used. (Ironically, a bridge oscillator is being used to measure a bridge detector. ) The oscillator uses a TL074 quad op-amp, although only two of the op-amps are actually used. Op-amps typically require two power supplies, o ne positive and one negative. To avoid this expensive requirement, a "virtual ground" was created for the oscillator at precisely the midpoint between true ground and the supply voltage. The first op-amp (U1A) supplies the virtual ground while the second op-amp (U1B) implements the oscillator.
U1A is configured as a "voltage follower", that is to say its output tracks the voltage on U1A+. The 10-turn pot at U1A+ centers virtual ground at one-half of the input voltage. The U1B- 10-turn pot adjusts the gain of the oscillator. When enough gain exists, a sine wave appears at Output. The two diodes stabilize the oscillator. Oscillation occurs when the reactance of one RC arm is equal to the reactance of the other RC arm, and occurs at a frequency of 1/(2*pi*RC). Due to capacitor and resistor tolerances, frequency will deviate somewhat from the equation. Therefore, frequency is measured directly from the oscilloscope. The theory behind the Wein Bridge oscillator is beyond the scope of this discussion. For more information, the reader is directed to a college textbook on oscillator theory. A Dual Trace Storage Oscilloscope was used for this experiment. By storing the waveform, 10 or more cycles can be displayed and a more precise frequency measurement can be obtained.
Before each E-meter measurement is taken, the oscillator voltage is precisely controlled to yield an output of 10. 0 Volts peak-to-peak (Vpp), +/-. 05 volts. The E-meter has 40-50 divisions on its face, so the reading is simply the number of divisions the needle "swings" in response to the standard 10 Vpp signal.
The Tone Arm is used to center swinging needle on the meter and to further adjust the lower side of the swing exactly on a division mark. The E-meter alligator clips hold a 5. 6K resistor. Hubbard uses a 4. 99K precision resistor to calibrate the E-meter for females, and 7. 50K for males. Thus, 5. 6K is within the specified operating range of the meter. The oscillator is always set for the same amplitude for each frequency, in this case 10. 0 Vpp Output, which is coupled to the E-meter with a 150K resistor. This sets the injected current into the E-meter at 10/150K = 66 ua pp. Oscilloscope ground, power ground, and one side of the E-meter are tied to a common point. Various resistance values were used to adjust the frequency. Three measurements per frequency decade were taken, with intermediate measurements taken when something "interesting" was happening.
The raw data is tabulated below: freq(Hz) divisions R - - -. 071 31-10 = 21 1. 0M. 15 32-10 = 22 470K. 32 33-9 = 24 220K. 71 37-4 = 33 100K 1. 5 38-4 = 34 47K 2. 1 27-15. 5 = 9. 5 33K 3. 3 23-19 = 4. 0 22K 4. 9 1. 5 15K 7. 1. 5 10K When the e-meter probes are placed across a 5. 6K resistor, the `scope shows a pure DC sampling current. DC is not preferred, because DC will cause electrolysis, creating a mini "battery" to be formed at the skin/metal junction which can invalidate the measurement. When AC is used, this battery is reversed at every cycle, minimizing the effect. The E-meter has three ferrite toroids to protect it from induced RF pickup. There are no other frequency-sensitive components in the detector circuit that would account for the low corner frequency.
The "bump" at 1 Hz indicates that the system is underdamped. This is confirmed by Arnaldo Lerma`s contention that Hubbard required an underdamped meter movement for "proper" performance. (It should be noted that electrical systems design engineers attempt to achieve what is called critical damping.
When a system is critically damped, it wil 🔗 External reference
Related Circuits

U1a serves as an oscillator, while U1b functions as the measurement component of the circuit. It converts an unknown capacitance into a pulse-width modulated signal, similar to the operation of an automotive dwell meter. The meter is linear, meaning...
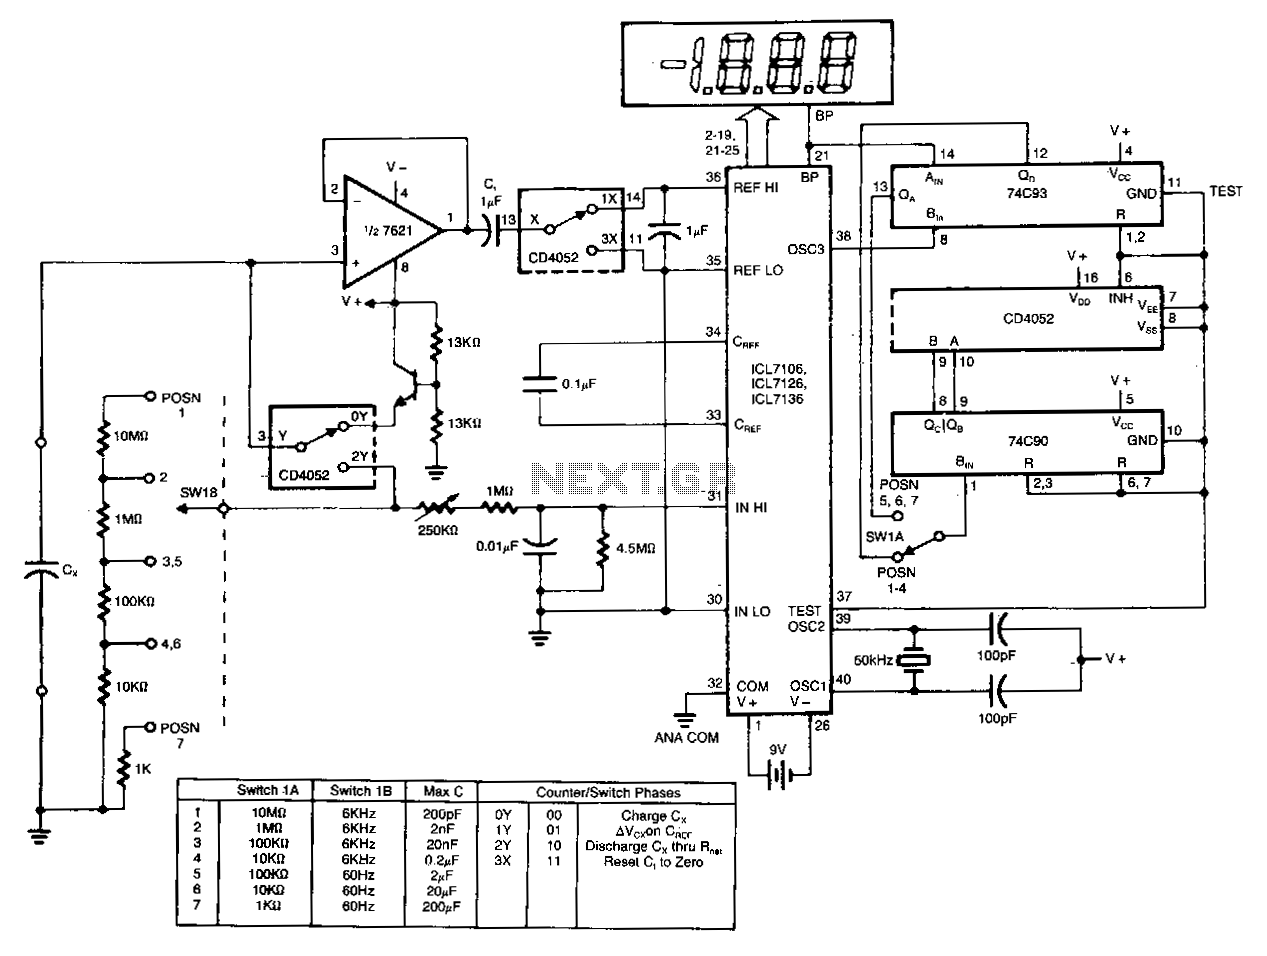
The circuit charges and discharges a capacitor at a crystal-controlled rate and stores the change in voltage achieved on a sample-and-difference amplifier. The current flowing during the discharge cycle is averaged and ratiometrically measured in the analog-to-digital converter (ADC)...
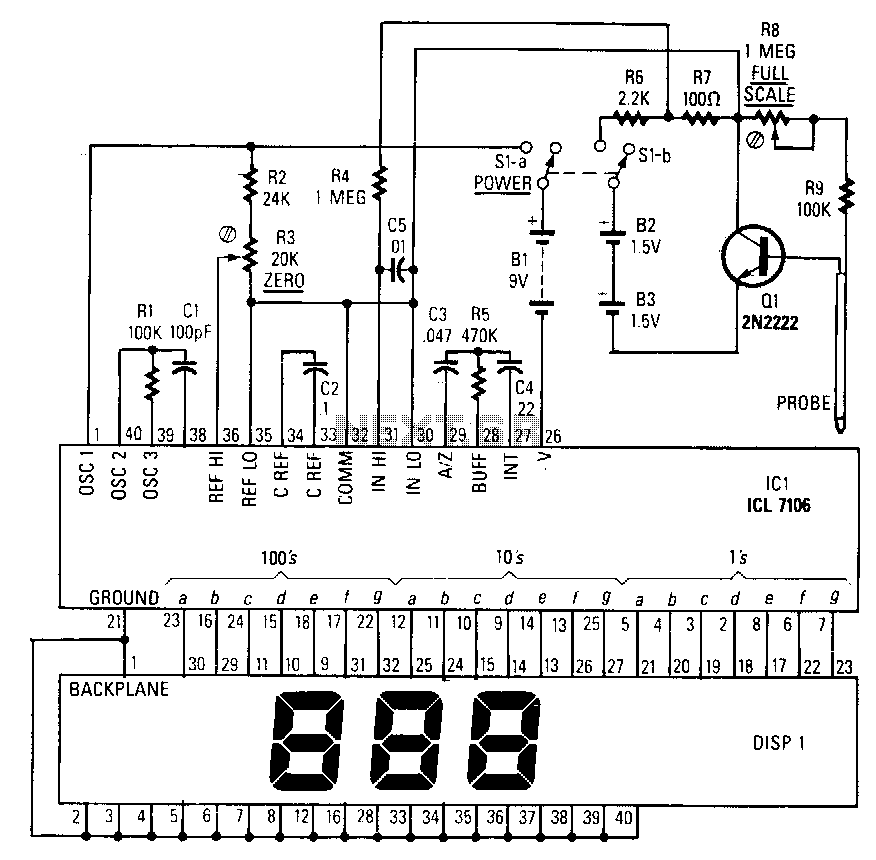
The ICL, specifically the Intersil ICL 7106, integrates an analog-to-digital converter, a 3.5-digit LCD driver, a clock, a voltage reference, seven-segment decoders, and display drivers. An alternative component, the ICL7107, is available for driving seven-segment LEDs. The probe body...