
avr oscilloscope nokia lcd
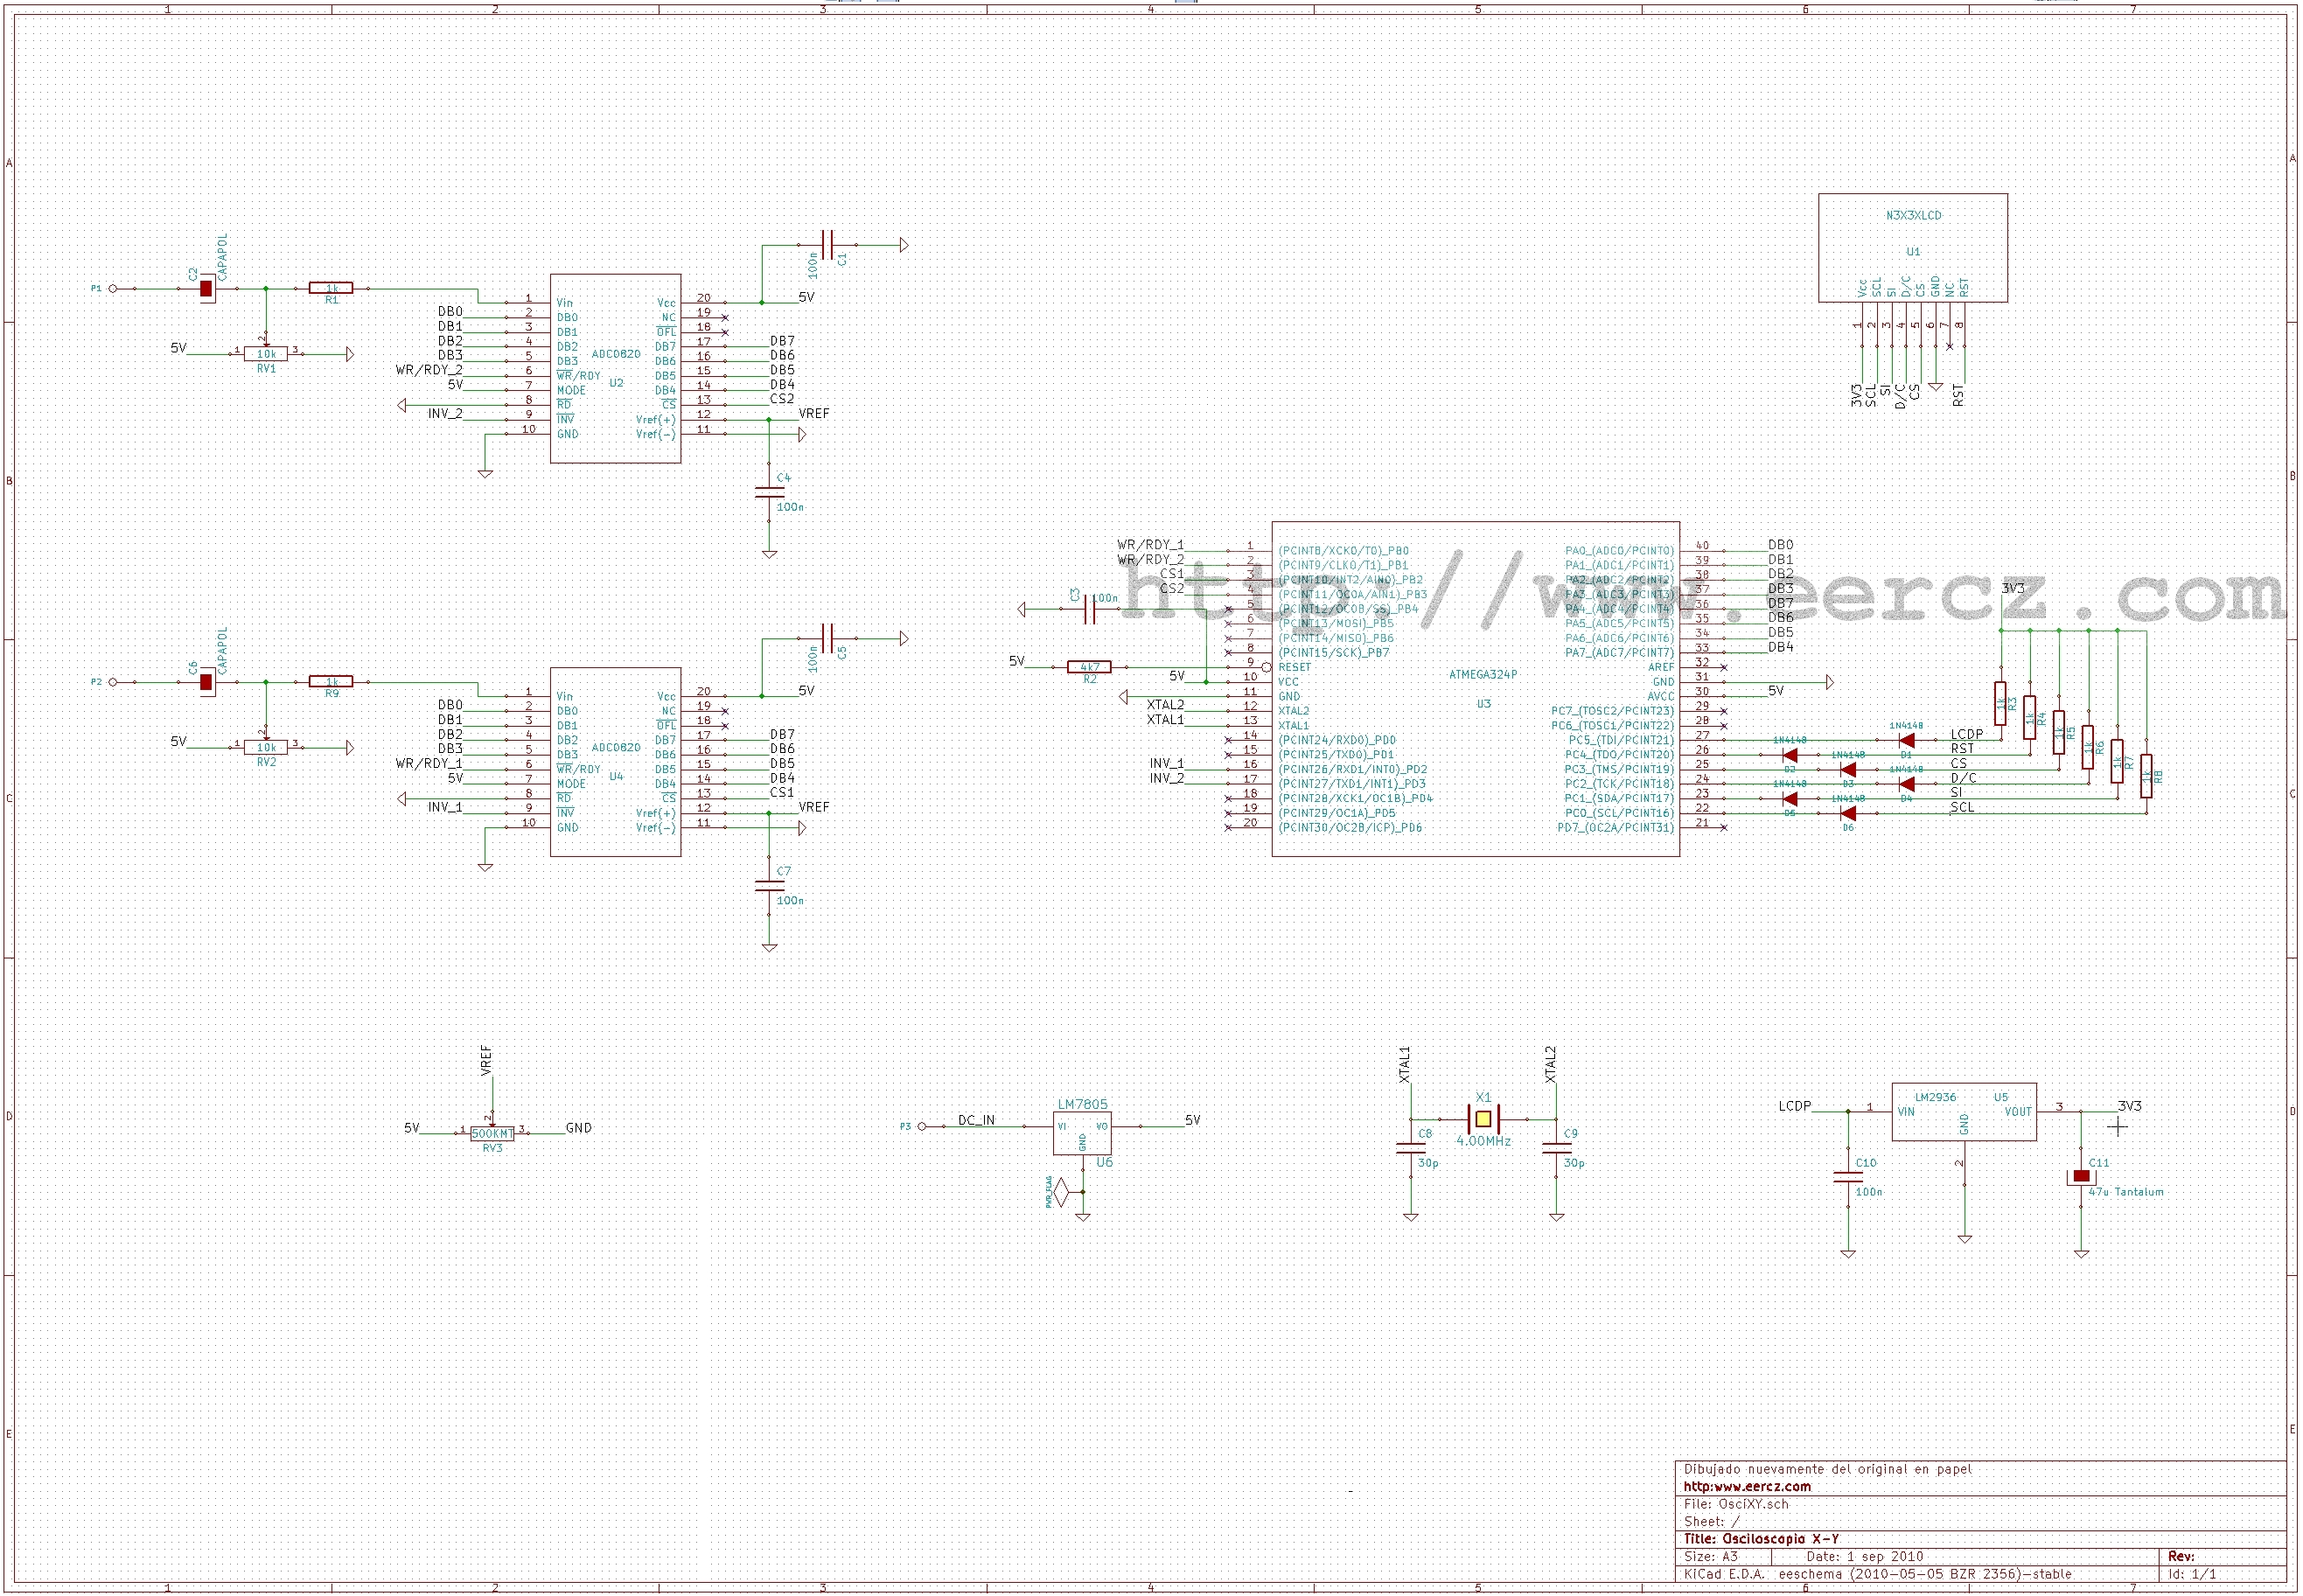
Two ADCs are utilized: one for the X-axis and the other for the Y-axis. The output from the converters is scaled down and used as coordinates to plot points on the screen. Feeding a sine wave to each channel with a phase offset of π/2 radians results in the display of a circle. The ADC0820 operates in WR-RD mode, which is the fastest available, with a conversion time of 1.5 µs per sample. The microcontroller continuously reads data from the ADCs in an infinite loop, achieving a read rate of approximately 1666 times per second. The higher speed of the ADCs is beneficial, as using the internal converters of the ATmega324P, which have a slower conversion time of about 13 µs, resulted in noticeable distortion in the curves. Both ADC0820 conversion cycles initiate within nanoseconds, allowing for nearly simultaneous conversions without the need to correct for phase discrepancies between the source signals.
To avoid complicating the firmware with the ATmega324P's internal converters, the original circuit design was retained, and the existing C source code was adapted for the newer microcontroller. Capacitors C2 and C6 block the DC component of the input signals, while variable resistors RV1 and RV2 provide DC bias to the AC signals, centering the displayed curves on the screen. Magnification can be slightly adjusted by modifying the reference voltage trimpot RV3. This oscilloscope was intended for use with an audio card, so utilizing the card's volume control is the most effective method for adjusting the size of the displayed curves.
The Nokia LCD used in this project is sourced from the Nokia 3390/3310 mobile phone. In the schematic, pin 1 is identified as the contact adjacent to the plastic positioning pin located on the back of the LCD module. An old prototype board from a different project was employed for this experiment, facilitating easier assembly and providing backlighting, although alternatives are available. Numerous online resources detail the usage of the Nokia LCD, which can be easily found through various search engines.
When generating waveforms using a sound card, it is crucial to disable all sound enhancement features, such as bass boost and ambient simulation effects, to achieve clear curve representations. The Audacity audio editor was utilized to create the sound files, starting with rose curves followed by Lissajous curves. The equations for the roses were converted to parametric form, and a trigonometric identity was applied to express the X and Y equations as sums rather than products, as the audio software is limited to summing waves. In this setup, the right channel of the audio card is connected to the X input of the oscilloscope, while the left channel connects to the Y input. The focus is on the frequency ratios, with sine waves generated at frequencies that are multiples of the desired factors yielding optimal results. The frequency must be sufficiently high to ensure that the oscilloscope can display a complete curve within its simulated persistence limits. For k=2, a frequency of 1 was selected.This is an easy to build X-Y oscilloscope. To try this an ATmega324P and two KAD0820 (same as National Semiconductor`s ADC0820 ) were used. Originally this oscilloscope was built around an AT90S4414 hence the external AD converters. Some rose and Lissajous curves were used to test this oscilloscope. This circuit looks a bit messy as built on the protoboard, and takes a bit of experimentation to get it to work correctly. To begin with, I fed the same sinewave to both channels and once I got a reasonably clear diagonal line I proceeded to test other curves. The contrast setting for the LCD was set for a relatively cool 20 C (68 F) so if you try it in a warmer environment, your LCD could look a bit too dark.
There are two analog to digital converters (ADC) one of which converts a signal for the X axis and the other for the Y axis. The data from the converters is scaled down and then used as coordinates to draw a dot on the screen.
If you feed a sinewave to each channel with an offset of /2 radians, a circle will be drawn. The ADC0820 converters are in the WR-RD mode which is the fastest of both available modes, taking only 1, 5 uS to convert a sample, and the microcontroller reads them as often as it can from an infinite loop. The ADCs are read at a rate of about 1666 times per second, but the much higher speed of the converters is not exactly useless.
I actually tried with the ATmega324P internal converters and with its slower conversion time, about 13uS, the distortion in the curves was too obvious. Both of the ADC0820s conversion cycles are started within nanoseconds so the conversions are almost simultaneous and it`s not necessary to correct for phase changes between both source signals.
So instead of complicating the firmware to be able to use the Atmega324P internal converters I decided to build the original circuit and recompile the old C source code for the newer microcontroller. Capacitors C2 and C6 block the DC component of the signal and RV1 and RV2 give DC bias to the AC only signal allowing to center the curve on the screen.
Magnification can be marginally changed by changing the reference voltage trimpot RV3. As it was conceived to be used from an audio card, the card`s own volume control is the best curve size adjustment. The Nokia LCD used for this experiment is the one in the Nokia 3390/3310 cell phone. Note that in the pinout indicated in the schematic, pin 1 corresponds to the contact next to the plastic positioning pin in the back of the LCD module.
For this experiment I used an old prototype board that belongs to a different project. It made things much easier and also provided backlight, but you don`t need to use something similar. There are a lot of web resources that explain how to use the Nokia LCD. This link may help or search Google for so many other related webpages. When using a sound card to generate the waveforms, to get a clear curve, it is necessary to switch off all the sound enhancement features of the sound card, such as bass boost and the ambient simulation effects. To generate the sound files I used the Audacity audio editor. First I tried a few roses and then some Lissajous curves. To generate the roses I converted the equations to parametric form and then, using a simple trigonometric identity I converted the equations for X and Y from products to sums.
This is necessary because the the audio software can only sum the waves (as far as I know). In this experiment, the right channel of the audio card will go to the X input of the oscilloscope, and the left channel will be connected to the Y input of the oscilloscope. We are interested in the ratios between the frequencies, so generating sine waves of frequencies that are multiples of the factors obtained above will work perfectly.
The frequency must be high enough that the oscilloscope can show a complete curve within the limits of its simulated persistence. So, for k=2 I chose 1 🔗 External reference
Related Circuits
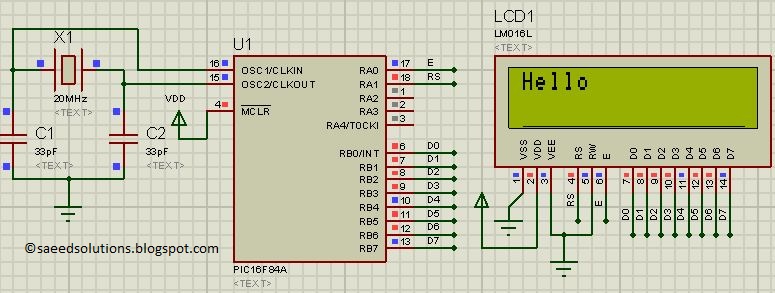
This post presents the LCD interfacing code utilizing the PIC16F84A microcontroller. The code is developed in the C programming language using MPLAB with the HI-TECH C compiler. The interfacing of an LCD (Liquid Crystal Display) with the PIC16F84A microcontroller...
This document provides an example of how to interface with the standard Hitachi HD44780 LCD using an 8051 microcontroller and the SDCC C compiler. A standard 16-character by 2-line LCD module is utilized, as illustrated in the schematic below....
The TRW-24G connector pins are quite small, approximately 1mm apart. To address this issue, an adaptor PCB has been ordered to convert the small connector of the RF module to a standard pin connector. The pin arrangement of the...
This circuit blanks the CRT starting just before retrace begins. Since the CRT sits at a -1200 volt potential, the blanking circuit must also be based at -1200 volts. Note the capacitors, C40, C41, and C43 which allow the...
The NanoVM is a java virtual machine for the Atmel AVR ATmega8 CPU, the member of the AVR CPU family used e.g. in the DLR Asuro robot, manufactured by AREXX engineering. With the NanoVM, the Asuro can be programmed...
LCD2USB is an open source/open hardware project. The goal of LCD2USB is to connect HD44780 based text LCD displays to various PCs via USB. LCD2USB was meant to be cheap and to be made of easily available parts. It...