
bassman tonestack low frequency
The circuit described pertains to a tone stack configuration used in guitar amplifiers, particularly the 5F6-A and its modified version by Marshall. The tone stack serves to shape the tonal characteristics of the audio signal by adjusting the bass and midrange frequencies. The component values, including resistors R1 and RM and capacitors C2 and C3, play a crucial role in determining the frequency response and gain of the circuit.
In practical terms, the adjustments made by Marshall to the component values are aimed at enhancing the amplifier's tonal response, particularly in the midrange frequencies, which are critical for achieving a rich and full sound. The reduction of R1 and the increase in capacitance values for C2 and C3 lead to a shift in the cutoff frequency, allowing for greater emphasis on the desired frequency ranges.
The analysis utilizes Bode plots to visualize the frequency response of the circuit, providing insight into how the different components interact to affect gain and attenuation across the audio spectrum. Understanding these dynamics is essential for engineers and technicians working with guitar amplifiers, as it enables them to optimize tonal characteristics based on player preferences and musical styles.
Overall, the modifications introduced by Marshall to the 5F6-A tone stack exemplify the ongoing evolution of amplifier design, where small changes in component values can lead to significant alterations in sound quality and performance. This understanding of frequency response and gain characteristics is vital for anyone involved in the design, modification, or repair of guitar amplifiers.Bass and midrange frequencies are greatly affected by Marshall`s substantial adjustment of R1 and somewhat influenced by the 10-percent increase in C2 and C3. In the paragraphs that follow we will describe how the circuit reacts to bass and middle-range frequencies, computing gain and transition frequencies for maximum bass and maximum midrange se
ttings. Once these key characteristics are known, the effects of Marshall`s modifications will be clearly evident. Finally we wrap up our analysis by drawing some overall conclusions on the low and midrange-frequency effects of Marshall`s modifications to the 5F6-A tone stack.
The classic way to analyze tone stacks is by using the magnitude plots of Hendrik Wade Bode, which were very popular in the 1950s and 1960s. So in the spirit of the time, I`m going analyze the 5F6-A tone stack and Marshall`s modifications in the way they were understood back then.
To begin our analysis, let`s look at bass and midrange frequencies when the bass control is at minimum and the midrange control is at maximum. At bass and middle-range frequencies C1 acts as an open circuit. Because of the high input impedance of the long-tailed-pair phase inverter, there is almost no current flowing through the treble control, thus making its particular setting irrelevant.
According to Ohm`s Law, the voltage at the top and bottom of the control is essentially the same at midrange and bass frequencies. With the bass control at minimum and the midrange control at maximum, the capacitors C2 and C3 are in parallel.
Putting all of this together, the circuit looks like this: The frequency response as a function of s has a pole at p if the denominator of the response equals zero when s = p. (If the variable "s" looks unfamiliar, please see our tutorial on Laplace notation. ) The response has a zero at z if the numerator equals zero when s = z. Poles and zeros represent key transition points in the frequency response. If we can derive an equation for one of the poles as a function of two or three component values, for example, then we know how these part values affect this particular transition point.
Let`s take a look at the extremes of frequency. At DC, where s = 0 we note that H(s) = 0 and there is zero output. At extremely high frequencies, where s approaches infinity, it becomes much larger than a and the response is Both of these conditions make sense, because at DC C2+3 is an open circuit, producing zero output, and at very high frequencies it acts as a short circuit, producing a simple attenuator formed by the voltage divider of R1 and RM. So we essentially have a simple high-pass filter. Above a certain cutoff frequency the gain is fairly constant. Below it there is increasing attenuation as the frequency decreases. In terms of dB, audio attenuation with the middle-range control set to maximum is With R1 = 56k and RM = 25k we get a gain of -10dB.
The Marshall JMP50 Model 1987 lowers the value of R1 to 33k, which provides -7dB of gain. We conclude that the output signal at middle-range frequencies, middle-range control at maximum, is 3dB higher in the Marshall. Using 5F6-A parts values we get f-3dB = 49Hz. In the Marshall, C2+3 is 10-percent higher but R1+RM is 28 percent lower, so the cutoff frequency rises to f-3dB = 62Hz.
To plot it we note that the overall gain in dB can be separated into the sum of two parts: one due to the gain constant and the zero and the other due to the pole: so for frequencies below 49Hz we plot a straight line at 0dB. At 49Hz we extend a line that decreases at a rate of 20dB per decade. The approximate gain is the sum of the two components that we have just plotted. Below 49Hz it is a straight line rising at the rate of 20dB per decade until it reaches -10dB at 49Hz.
Above 49Hz it remains a constant -10dB. The actual gain is 3dB lower at the break point, as shown in the figure. At frequencies much higher or much lower than 49H 🔗 External reference
Related Circuits
The Model LM-13 Crystal Calibrated Frequency Indicating Equipment has been specifically designed to provide a simple, accurate, and reliable frequency indication for the crystal calibrated type, intended for use in the U.S. Naval radio service. It is adaptable for...
This circuit exhibits good performance without an amplifier, having a gain of only one, with built-in parasitics due to the emitter follower negative feedback. Additionally, it serves to stabilize its gain. The circuit under discussion utilizes an emitter follower configuration,...
This circuit is a simple air flow detector that signals the presence of air flow. The sensor utilized is a filament incandescent lamp. Components include an air flow detector, a sensor, an LED, and an LM339 operational amplifier. The air...
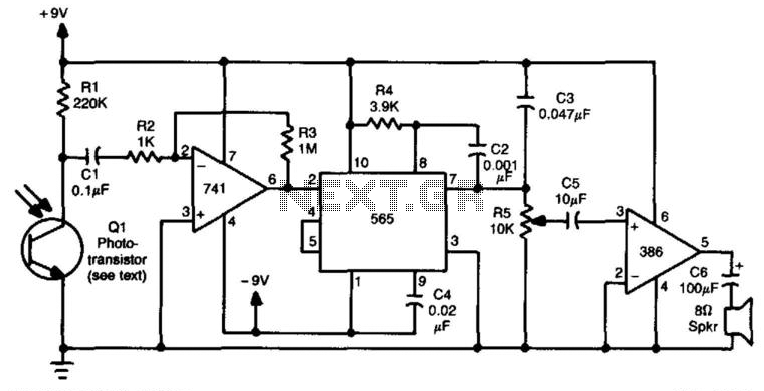
This receiver utilizes an IR-sensitive phototransistor (such as those from Clairex or HP) housed within a light-tight enclosure that features an aperture for the incoming infrared beam. An optical system may be integrated with this receiver to enhance its...
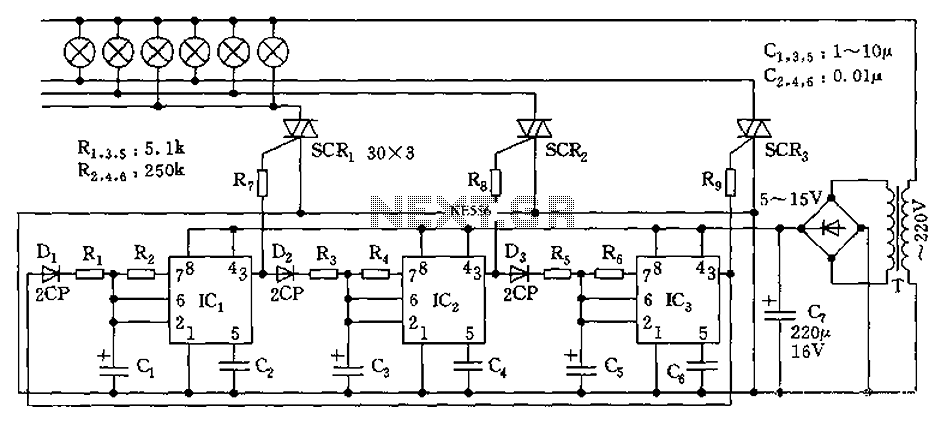
The circuit utilizes a 555 timer as its core component to control three lights through a cyclic trigger monostable delay circuit. The brightest light is controlled by a silicon-controlled rectifier (SCR) that determines the cycle of illumination. When pin...
This oscillator generates low-distortion sine waves within a frequency range of 16 to 22,000 Hz. The sine wave oscillator is designed to produce high-quality sine wave outputs with minimal distortion across a wide frequency spectrum. The operational range of 16...