
A high-performance FM receiver for audio and digital applicatons
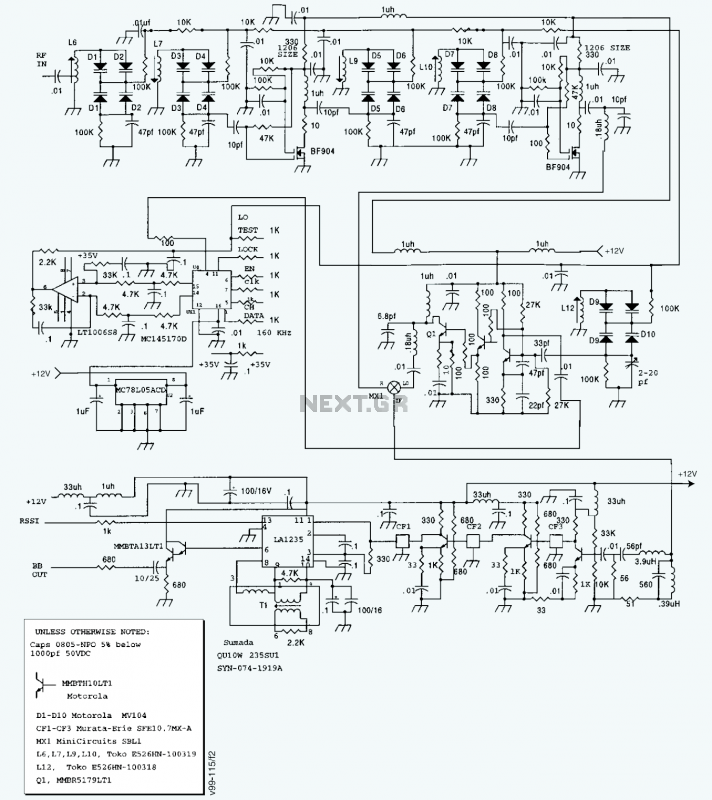
The described circuit consists of a receiver and a slot noise generator designed to evaluate the performance of FM receivers in environments with strong signals. The receiver schematic includes critical components such as RF amplifiers, mixers, and filters that work together to ensure effective signal processing. The first RF amplifier, Q4, amplifies the incoming RF signal, while the second amplifier, Q5, is matched to the mixer through components C23 and L11 to optimize signal transfer without overloading the mixer. The local oscillator, Q3, generates a stable frequency that is amplified in a two-stage configuration using Q1 and Q2, contributing to the overall gain and stability of the system.
The mixer output is terminated with specific components leading to Q8, which further processes the signal. The receiver bandwidth is controlled by capacitors CF1, CF2, and CF3, ensuring that the system can adequately filter and process the desired frequency range, approximately 200 kHz. The integration of U4 and U5 allows for phase locking, enhancing the oscillator's stability and performance.
In parallel, the slot noise generator is designed to create a controlled noise environment for testing. This device generates noise across the FM band and includes a narrow slot to evaluate the receiver's performance against strong signals. The noise is bandpassed between 2 to 10 MHz, with careful attention to filter designs to maintain the integrity of the slot. The mixing stage elevates the noise to the desired frequency range, specifically targeting a center frequency of 98 MHz. The implementation of multiple filters ensures that the slot's depth remains consistent and accurate, allowing for reliable testing results.
Overall, the combination of these circuits enables comprehensive testing and evaluation of FM receiver performance in real-world scenarios, addressing the challenges posed by strong signals and front-end nonlinearities. The careful design of each component and stage in the schematic is critical for achieving the desired performance metrics.A block diagram and a schematic of the receiver are shown in Figures 2 and 3, respectively. In Figure 3, L6 and L7 are spaced 0.6 inch for a loss of about 0.5 dB. Q4 is the first RF amplifier. L9 and L10 are spaced about 0.8 inch with a partial shield between them. The front-end gain is about 10 dB as measured at the input to the mixer. This gain is sufficient to overcome the loss of the mixer, but not to overload it. C23 and L11 provide a match between the output of Q5 (the second RF amplifier) and the mixer. The local oscillator Q3 is followed by a two-stage amplifier, Q1 and Q2. The components between the mixer output and Q8 provide termination for the mixer. CF1, CF2, and CF3 provide about 200 kHz receiver bandwidth. U5 is an IF amplifier, limiter, and detector. U4 and U5 provide phase lock for the local oscillator.
The purpose of the slot noise generator is to evaluate the front-end performance of an FM receiver that will be operating in a metropolitan area with strong signals. Because of front-end nonlinearities, the locally strong signals may add artifacts to a frequency occupied by a weak station.
A repeatable figure of merit had to be found to measure the front-end nonlinearities. Two-tone intermodulation testing does not adequately measure high-order intermodulation distortion. One measurement method is the use of over-the-air stations. However, if the antenna is moved in any way, or if atmospheric conditions change, results are no longer valid. Also, it would be difficult to find an empty space in the FM band with sufficient bandwidth to add a test signal.
A second method is the combination of the output of 50 small FM trans- 30 www.rfdesign.com October 2000 mitters, all modulated with different program material. However, unless this is done with extreme care, the transmitters could intermodulate, filling the test slot with noise.
In addition, this is a rather complex measurement method. A third approach is to generate noise over the entire FM band with a narrow deep slot placed in the noise at the center of the FM band. The ratio of noise in and out of the slot is defined as the noise power ratio. However, generating a slot in the noise with the required 1% bandwidth with steep skirts would be difficult.
One approach might be to generate the noise at baseband, bandpass it from 2 to 10 MHz, and mix it up to the frequency of interest. Mixing and amplifying must be linear so as not to add noise in the slot. A noise power ratio of greater than 50 dB might be achievable. In fact, such a device was successfully constructed, with a measured slot noise depth of –30 to –58 dB, depending on the spectrum analyzer used, and with a spectrum analyzer bandwidth of 300 kHz (random noise is generated from 0 to 15 MHz).
A block diagram and a schematic of the slot noise generator are shown in Figure 4. Next, it is bandpassed from 2 to 10 MHz. The 2 MHz filter edge defines the width of the slot and the 10 MHz filter edge keeps noise out of the image frequency. Two filters were implemented to avoid slot noise depth problems. The signals were mixed up to 98 MHz using +17 dBm LO mixers. The two signals were then amplified and combined. A second combiner allows the addition of a test signal in the slot. In the frequency plan shown in Figure 5, the baseband noise is down 3 dB at 2 and 10 MHz and down 60 dB at 1.5 and 17 MHz.
Noise is mixed up to 97.35 MHz and 98.85 MHz for a center frequency of 98.0 MHz. Figure 6 shows a slot noise width at about 2 MHz with a depth of about 56 dB using a Tektronix 7L14 or 2712. All slot noise testing was done with a spectrum analyzer bandwidth of 300 kHz.
Related Circuits
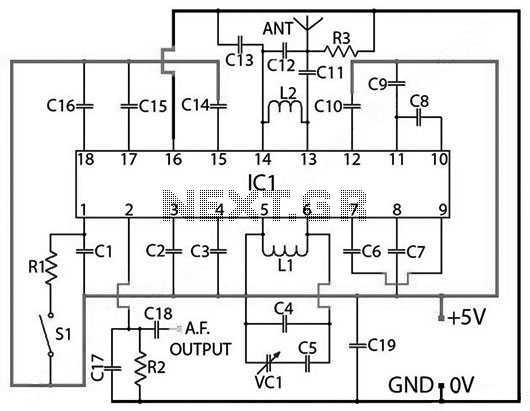
PARTS LIST C1 0.22 µF (224) C2 22nF (223) C3 10nF (103) C4 27pF C5 22pF C6 3.3nF (332) C7 180pF (181) C8 330pF (331) C9 3.3nF (332) C10 150pF (151) C11 82pF C12 68pF C13 220pF (221) C14...
A highly accurate digital thermometer utilizing an LM35 probe with a resolution of 0.1 degrees Celsius. The circuit includes two adjustable components. The first, R5, is used to calibrate the display to zero. To perform this calibration, the end...
The GPS is based on 24 satellites located in six orbital planes at a height of 20,200 km and circle the Earth every 12 h. Each plane is inclined at 55 to the Earth’s equator and contains four satellites....
The modular Portable Mixer design featured on these web pages has gained popularity among many amateurs; however, some users have requested a simpler device primarily for mixing mono signals. This design aims to meet those requirements, incorporating three inputs...
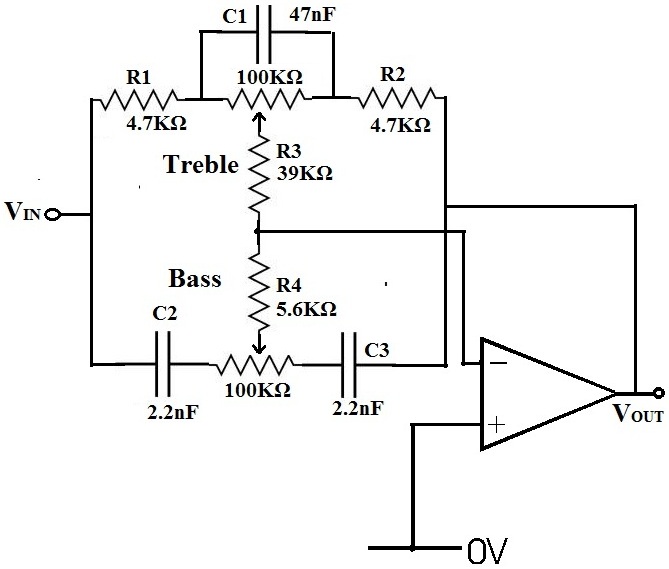
An equalizer is a device that allows for the adjustment of the gains of individual frequencies. For instance, to reduce bass, one would navigate to the frequency range around 500Hz and decrease the volume. Conversely, to enhance treble, one...
Utilizing an analog audio line delay, it is possible to virtually adjust the size of a room. By simply turning a knob on the audio equipment, one can modify the perceived room size. The circuit described herein facilitates this...