
Filter For Audio Measurements
The Fletcher-Munson curves, also known as equal-loudness contours, illustrate the relationship between sound pressure level (SPL) and human hearing sensitivity across different frequencies. These curves demonstrate that human perception of sound intensity varies significantly with frequency, indicating that at lower SPLs, the human ear is less sensitive to low and high frequencies compared to midrange frequencies. This phenomenon necessitates the use of specific audio filters and equalization techniques to adjust sound output for more accurate representation, ensuring that audio signals are perceived as intended across varied listening levels.
In practical applications, this understanding is crucial for audio engineers and sound designers when calibrating audio equipment. For instance, when designing a sound system or creating music, it is essential to consider the Fletcher-Munson curves to adjust the frequency response of speakers or headphones accordingly. Implementing a multi-band equalizer can help achieve a balanced sound by compensating for the ear's reduced sensitivity at specific frequencies, particularly at lower SPLs.
To accurately model the Fletcher-Munson effect in a circuit, a combination of band-pass filters can be utilized to create a frequency response that mimics the equal-loudness contours. Each filter can be tuned to specific frequency bands (e.g., low, mid, and high frequencies) with variable gain settings that adjust based on the input SPL. This approach allows for a more nuanced representation of sound that aligns with human auditory perception, enhancing the listening experience across various volume levels.
Overall, the incorporation of the Fletcher-Munson curves into audio engineering practices underscores the importance of understanding human auditory sensitivity and its implications for sound reproduction in both live and recorded environments.The purpose is supposedly to account for the fact that human hearing is less sensitive at low and high frequencies than in the upper midrange, and that this variation is dependent upon the sound intensity (SPL). The Fletcher-Munson curve (as it is commonly known, and reproduced below) shows the variation, and it is clear that any loss of sensitivity is highly dependent upon the actual SPL.
The idea that a single filter can represent this at all levels is clearly wrong, but it is a standard nonetheless. (Interestingly, being wrong has never stopped a standard from being imposed, and this is probably truer in the audio industry than almost any other I can think of.)
The premise behind all this is that as the SPL is reduced, our ability to detect low or high frequency noise is reduced, so measurements should reflect this phenomenon. While it is undeniable that the chart above represents reality in terms of human heari 🔗 External reference
Related Circuits
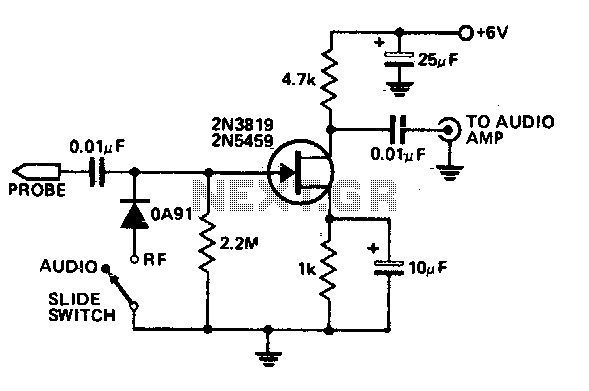
This economical signal tracer is useful for servicing and alignment work in receivers and low power transmitters. When switched to RF, the modulation on any signal is detected by the diode and amplified by the FET. A twin-core shielded...
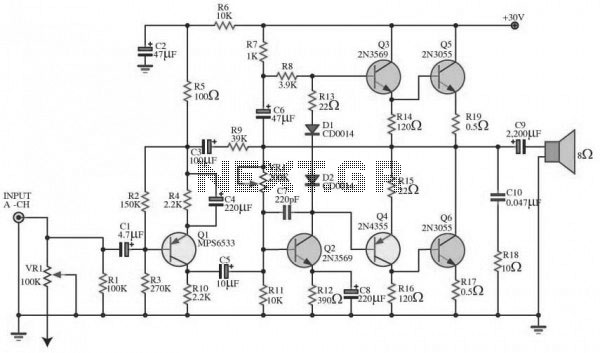
At first glance, this circuit appears to be quite complex; however, it can be segmented into high-pass and low-pass filter sections, followed by a summing amplifier with a gain of approximately 20 times. The supply rail voltage is +/-...
The circuit is based on four integrated circuits: TL072, TL074, MN3101, and MN3004, which produce four output channels for surround audio, specifically targeting center, rear, front right, and front left audio. It is a compact amplifier capable of delivering...
A schematic diagram for a broadband QRP SWR metering circuit intended for use in a QRP antenna tuner. The circuit allows the user to press a momentary DPDT switch to observe an LED indicator while adjusting the capacitors of...
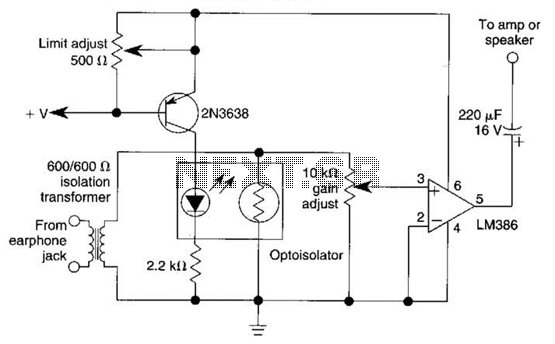
An optoisolator is utilized as an attenuator in this circuit. When the LM386 draws more current from audio signals, the 2N3638 activates, which biases the optoisolator on, thereby reducing the volume. The circuit employs an optoisolator to achieve signal attenuation,...
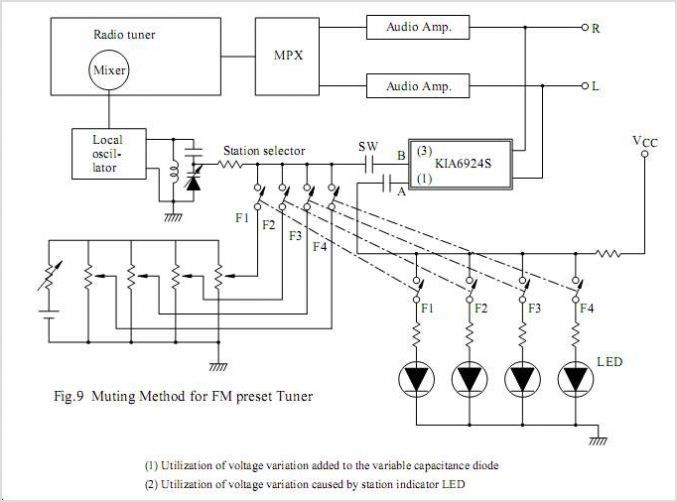
KIA7042AF is a subpackage of KIA7019AF. For further details, please refer to the KIA7019AF description. The datasheet for KIA7042AF can be downloaded from the link provided below. This component is produced by Korea Electronics (KEC). The KIA7042AF is a linear...