
RealView 2.0
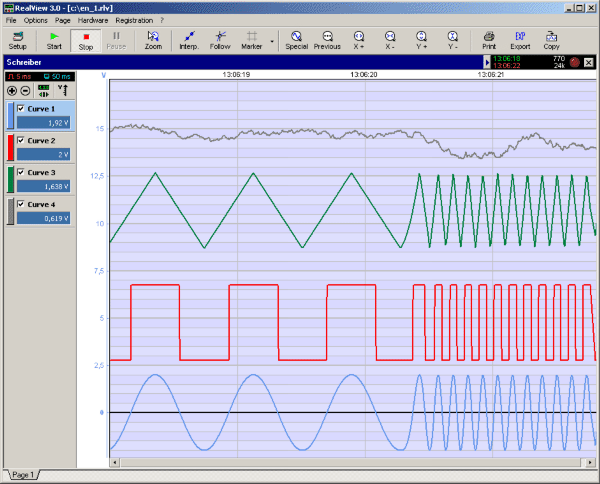
RealView operates by interfacing with various analogue hardware devices to capture real-time measurement data. The application is designed to handle multiple data streams simultaneously, allowing for the plotting of several curves on a single graph. Each curve represents a different measurement channel, enabling users to compare and analyze multiple parameters concurrently.
The plotting functionality is customizable, with options for adjusting pen width and color to enhance visual clarity and distinction between curves. This feature is particularly useful in multi-curve scenarios where different data sets must be easily identifiable. The application supports a flexible layout, allowing users to organize multiple diagrams across one or more pages, which is advantageous for presentations or detailed analysis reports.
RealView's sampling rate flexibility ranges from 5 milliseconds to 30 minutes, accommodating a wide variety of measurement scenarios, from fast transient events to slow-changing processes. Users can initiate measurements without a predefined duration limit, ensuring that long-term monitoring tasks can be conducted without interruption. Each plotted curve can have its own Y-axis, facilitating the display of data sets with different units or scales, thus enhancing the application's versatility in handling diverse measurement types.
Overall, RealView serves as a powerful tool for engineers and researchers, providing a robust platform for real-time data acquisition and visualization from analogue sources.RealView is a measurement application, which records and plots measured values from analogue hardware devices in real-time. Several curves can be plotted into a single diagram. Several diagrams can be arranged on one or more pages if necessary. Plot options like pen width or pen color can be used to create perfectly styled diagrams. RealView records and plots your measurement values in real-time. The sample rate can vary from 5 ms up to 30 min. There is no limit in the duration of the measurement. You can display several curves in the same plotter. Each curve can have their own Y-axi 🔗 External reference
Related Circuits
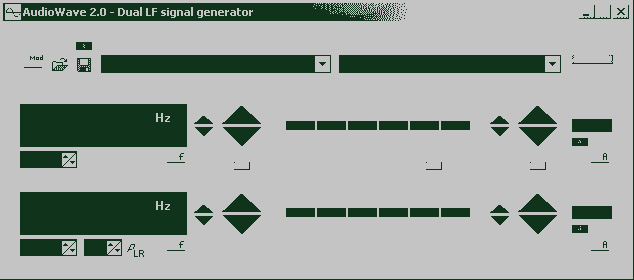
With AudioWave 2.0 your soundcard becomes a comfortable LF-signal-generator, which produces signals from 1Hz to 20 kHz with a resolution of 1 Hz. Phase shift between left and right channel is adjustable from 180° to +180° and an attenuator...
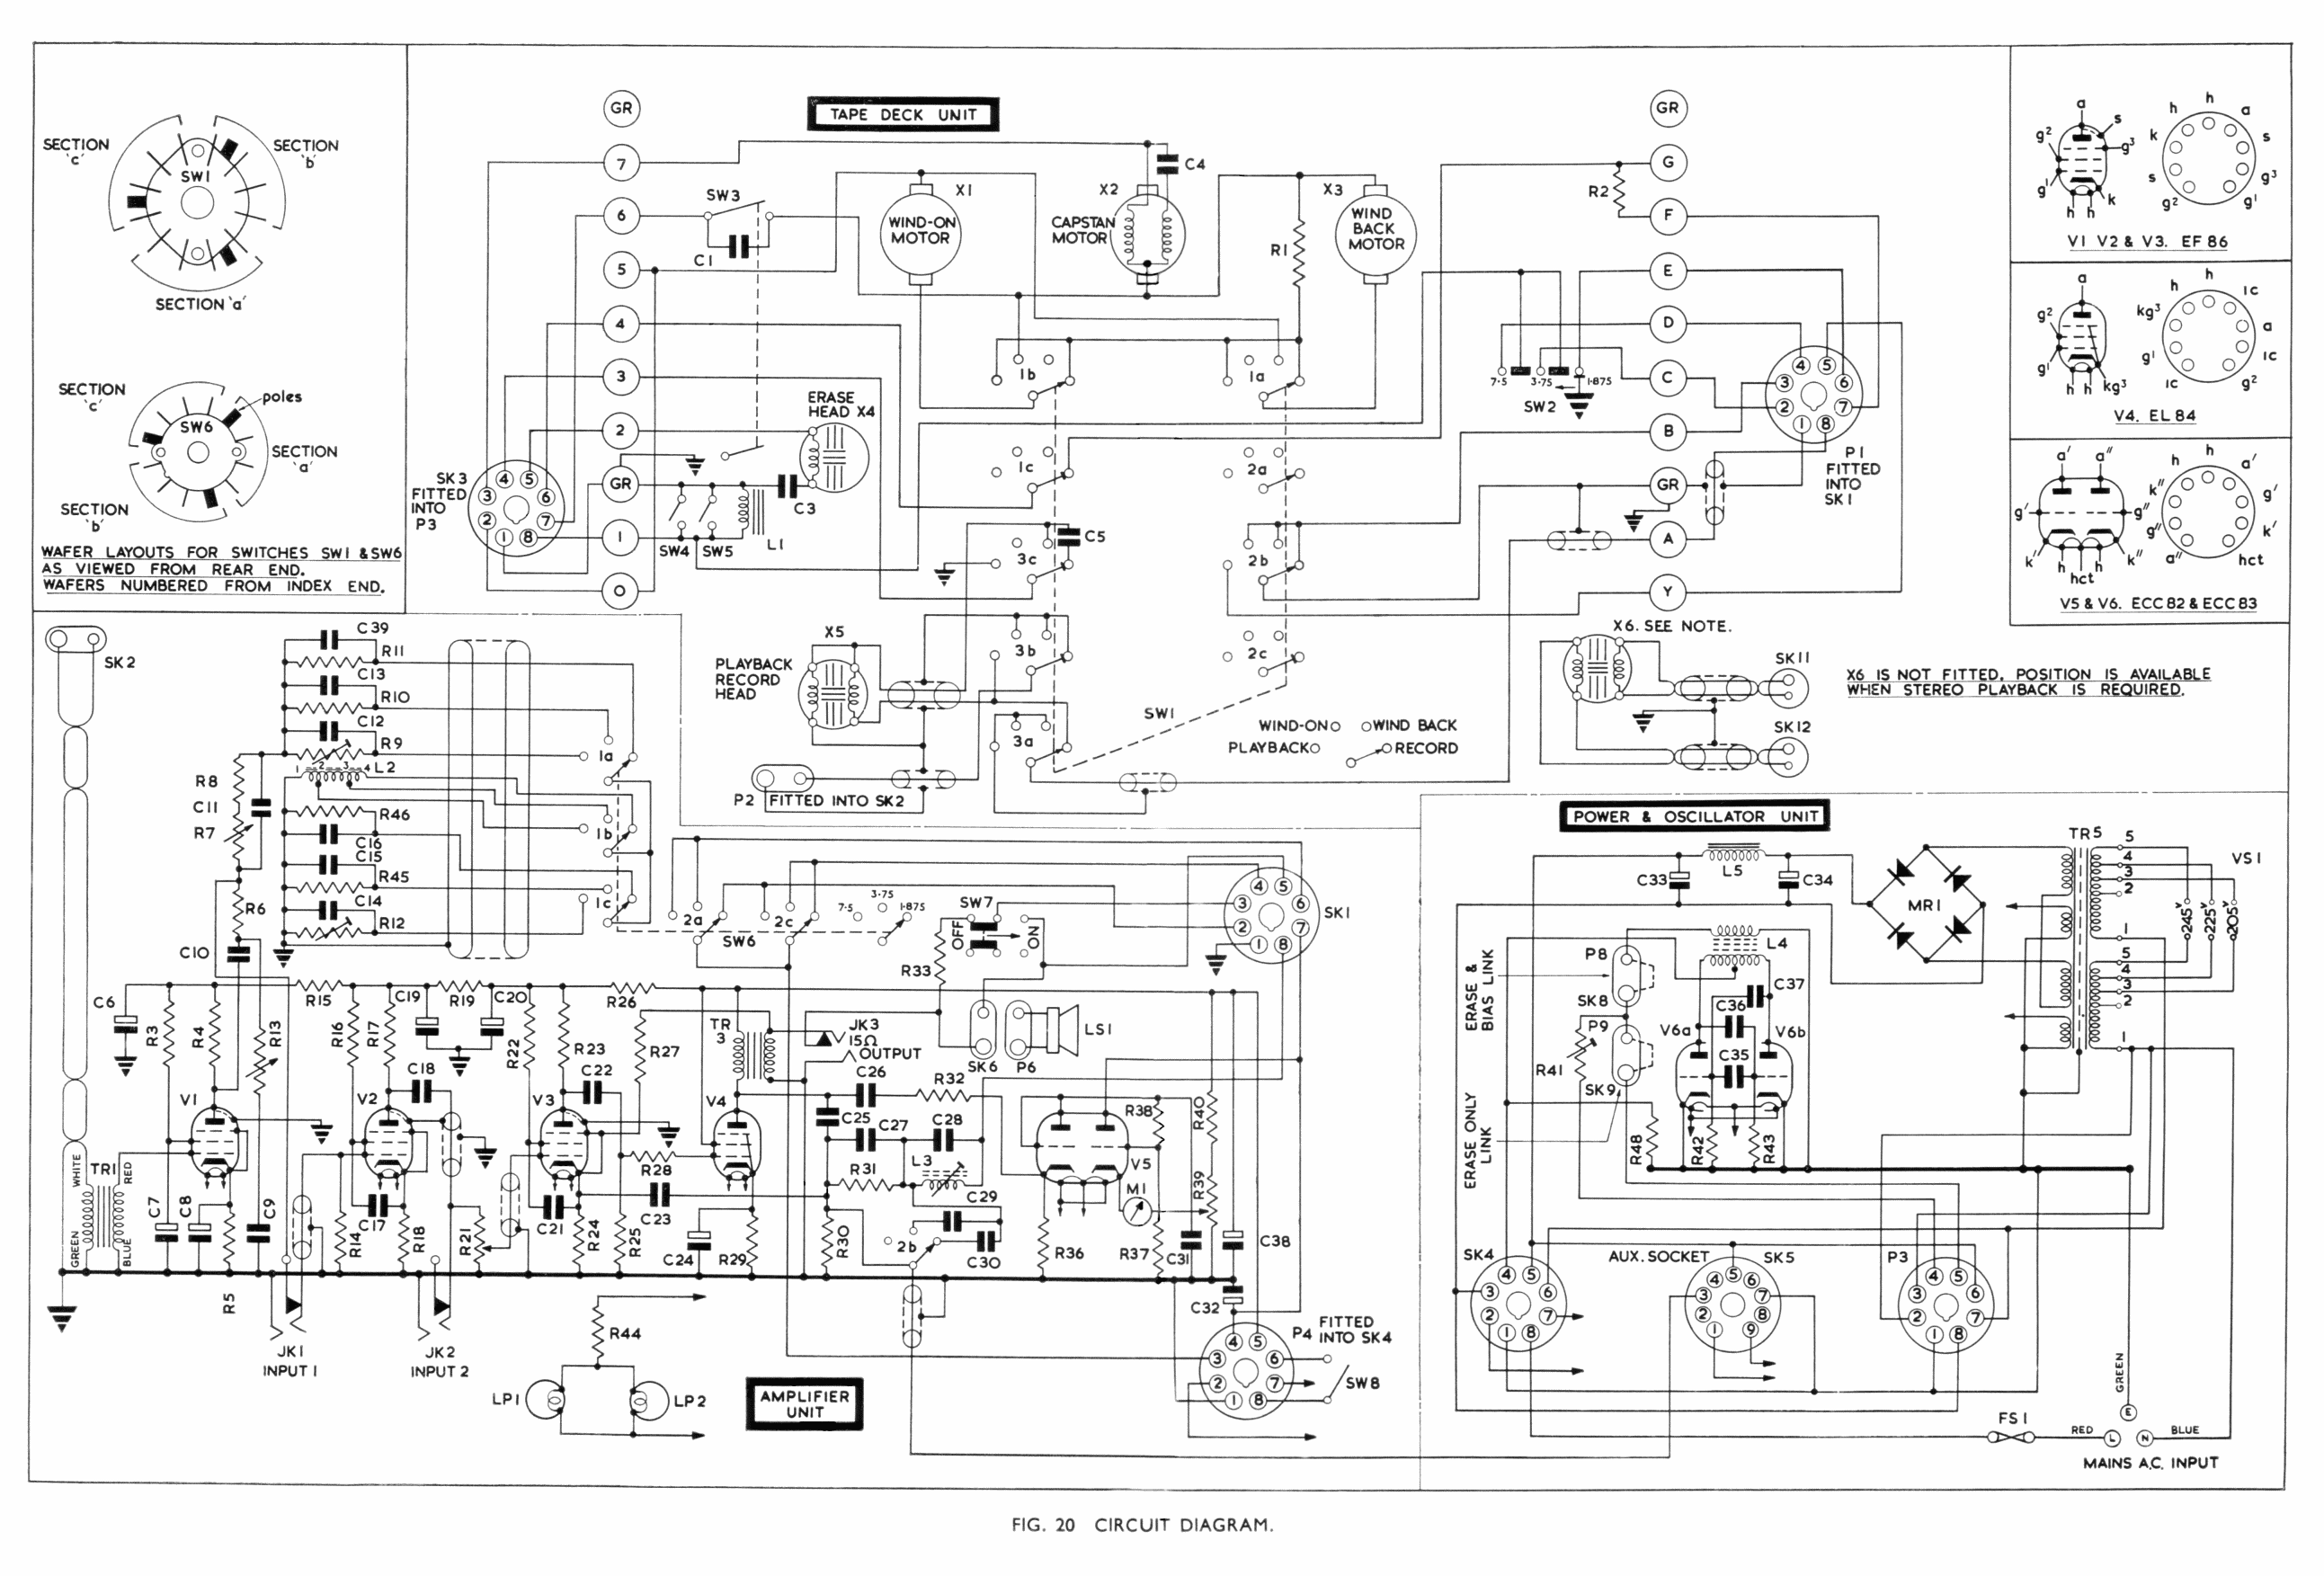
This product is highly effective. The computer was experiencing problems with the registry. After installation, scanning, and correcting the errors, the computer now operates as if it is brand new. It is recommended for others. The electronic schematic for a...
The WS2512-TR1G is a Wide-band Code Division Multiple Access (WCDMA) Power Amplifier (PA) designed as a fully matched 10-pin surface mount module, specifically developed for WCDMA handset applications. This power amplifier module operates within a frequency range of 1920-1980...
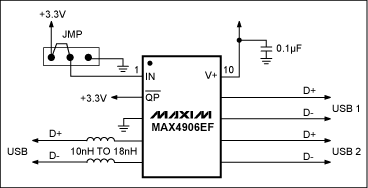
By incorporating discrete inductors in series with the device, it is possible to "tune out" some of the capacitance and enhance the eye opening. By adding sufficient inductance to peak the third harmonic at 240 MHz, while considering the...
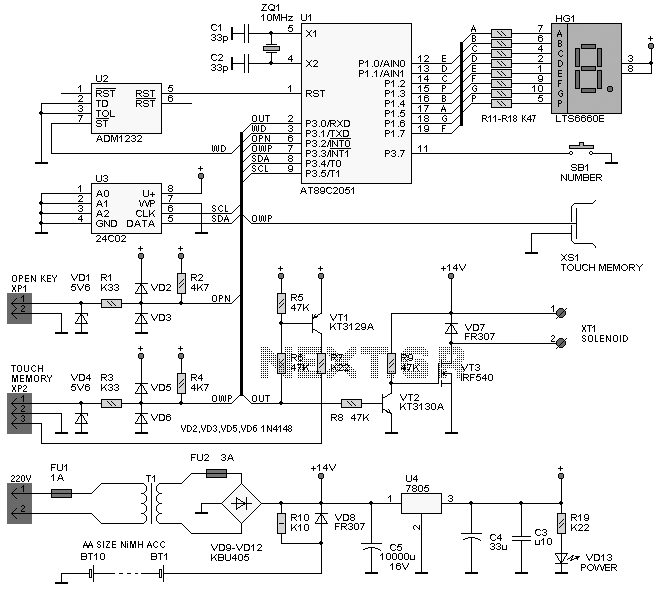
Diode D1 and resistor R1 provide VDD isolation during the programming of 24-pin devices. Jumper J3 must be shorted for 24-pin devices and left open for programming 28-pin devices. The following EEPROMs are pin compatible with their EPROM versions. In...
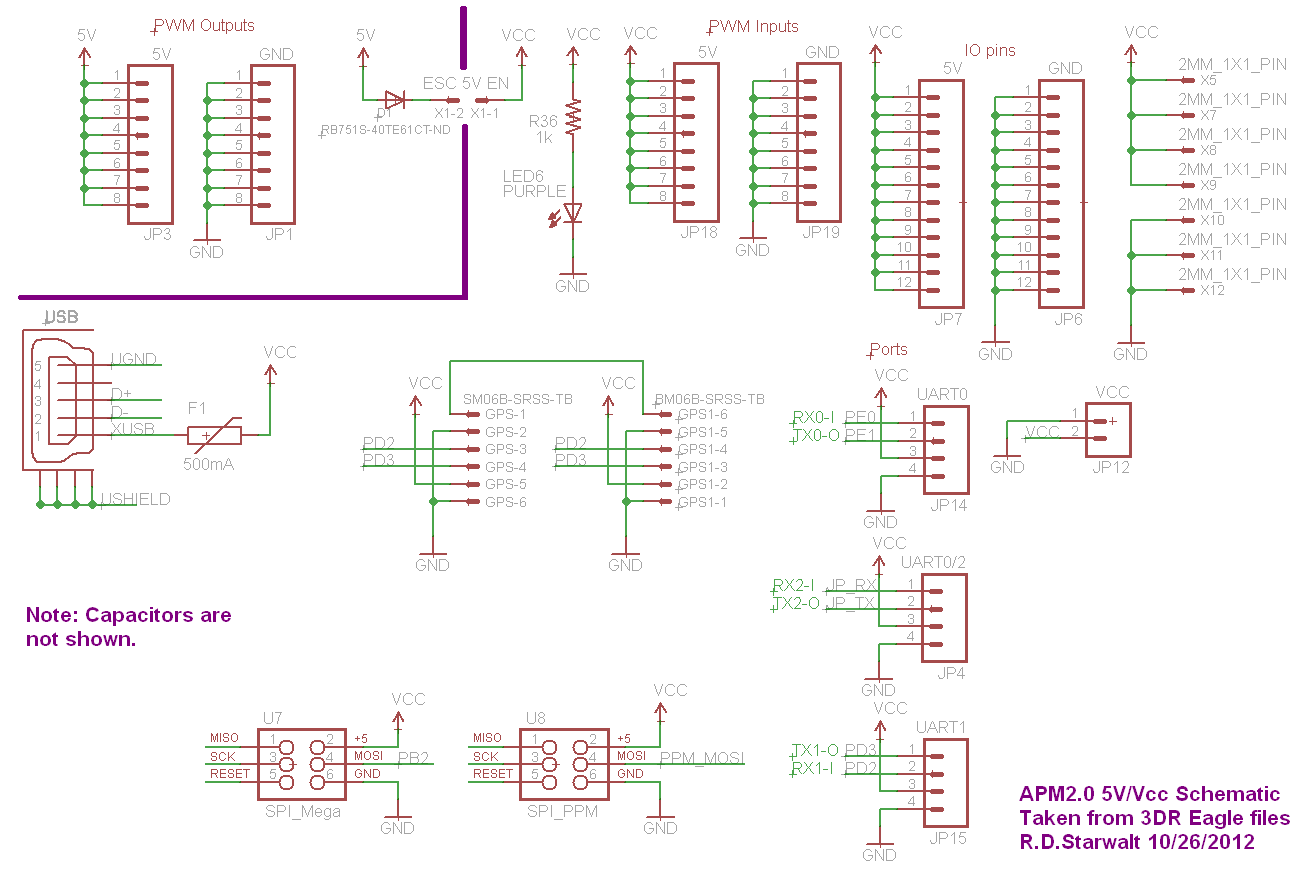
The PWM Output section has been separated into the upper left corner, delineated by a heavy purple line that is bridged by jumper JP1 on the APM2.0. This design choice highlights that diode D1 allows current to pass through...