
Arduino based electricity meter

The described circuit employs an infrared light source and a photodetector to create a non-intrusive method for monitoring electricity consumption. The disc, marked with a dark red line, acts as a reflective target for the infrared light. As the disc rotates, the sensor detects the transition of the red line, triggering an interrupt on the Arduino. This interrupt-driven approach ensures that only significant changes are processed, minimizing false readings caused by ambient light fluctuations or sensor noise.
The use of a potentiometer allows for fine-tuning of the sensor's sensitivity, ensuring reliable operation under varying conditions. The compact design, utilizing an Arduino board and minimal external components, facilitates easy integration into existing electrical systems, such as electricity meters. The housing in a cassette tape box not only serves a practical purpose in protecting the circuit but also demonstrates the adaptability of electronic components for creative solutions.
The incorporation of a web server into the Arduino's functionality enhances user interaction, allowing for real-time monitoring and data visualization. By leveraging Google Charts, users can access a graphical representation of their power consumption, making it easier to analyze usage patterns. The ability to retrieve data from the SD card for further analysis in applications like Excel adds another layer of utility, enabling users to track their energy consumption over time.
The decision to implement a custom time conversion function illustrates the importance of optimizing resource use in microcontroller applications, particularly when memory is limited. This tailored approach ensures that the system remains efficient while providing accurate time-stamped data for logging and analysis. Overall, this circuit design exemplifies practical engineering solutions for energy monitoring, combining hardware and software elements to create an effective tool for tracking electricity usage.The idea is that the infra-red light is reflected by the disc, except by the dark red line. The reflected light is received by the sensor and this way the Arduino can keep track of the number of revolutions. Note that the infra-red sensor is sensitive to a certain frequency of infra-red light (36kHz in this case), this makes it insensitive to changes in the ambient light.
Note that the entire circuit is pretty compact and that it can be made by sticking the components directly in the Arduino and bending their pins, only a few cables are needed to connect the LED and sensor to pin 3 and 8 respectively. In fact my father and I managed to get the whole thing into an old clear plastic box for holding a cassette tape.
We did have to make a hole in it though, because the plastic reflected to much IR light and made it impossible to read the electricity meter. In the end we taped the whole box to the electricity meter. It took a bit of fiddling to get the led and sensor aligned to the disc, and them some turning of the potentiometer to tune the sensitivity; if the resistance is too low, the led will give off to much IR light and the sensor will react even when the red line on the disc crosses in front of it.
The program for the Arduino and contents of the SD card are at the bottom of this post. Note that I used dutch terms in the program, since my father is more comfortable with his native language. The program does several things: It installs an interrupt service routine that reacts to any change on pin 8, i.
e. the sensor. This interrupt routine then starts a timer that will trigger an other interrupt in a few milliseconds. If the sensor changes back to its old value before the timer expires, the change in sensor state is interpreted as noise, and the timer is stopped.
So the sensor has to give a stable value for a few milliseconds before the value is used by the Arduino program. The program interprets a change in the sensor as the passing of the red line on the disc. It knows that (in case of my parents meter) there are 187. 5 revolutions per used kWh. So using the time since the last revolution it calculates the current power usage in Watts. Additionally, the Arduino contains a web-server that allows access to the contents of the SD card, so that the CSV files can be retrieved and plotted in Excel.
Furthermore the web-server is smart enough to replace parts of an HTML file with data from it`s memory, or files from the SD card. In effect any hash sign (#) followed by a number is replaced by something else. So I crafted an HTML file (in the ZIP file below) that is automatically filled with data, it also uses Google Charts to display the current power usage, and the usage from the past day in a graphical manner.
Because Google charts are processed client-side, it off-loads the Arduino. Oh, to have the Arduino write the data to SD with the correct time stamp, it also retrieves the current time from an NTP server. Originally I used the excellent Timezone library to convert the UTC time from NTP to the local time in the Netherlands.
But with all the features in my program I was running out of program memory on the Arduino. So I wrote some dedicated functions for the conversion myself, which are a lot smaller, but can only handle the Amste 🔗 External reference
Related Circuits

This voltmeter utilizes a pair of JFETs in a balanced-bridge source-follower amplifier circuit. Q1 and Q2 should be matched within 10% for IDSS. This configuration minimizes meter drift and maintains bridge balance over temperature. The described voltmeter is an advanced...
Any LED can be used for D1 - D10; however, blue LEDs require a higher voltage, which may result in them appearing dimmer compared to red, yellow, or green LEDs. If pin 9 of U2 is left disconnected, the...
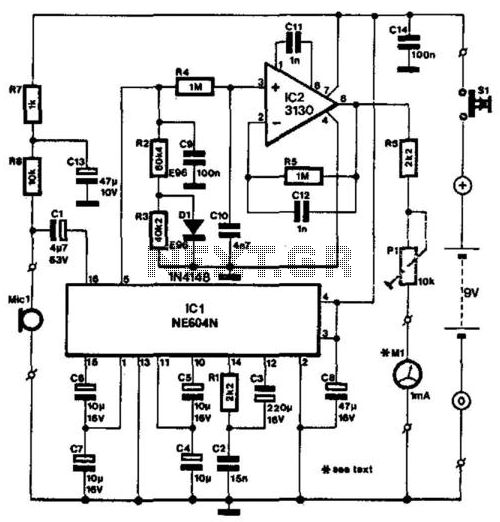
The NE604's signal-strength indicator section utilizes an internal logarithmic converter, allowing for a linear decibel scale. This feature enables the replacement of the moving-coil meter depicted in the diagram with a digital instrument. The assumed signal source is an...

This inexpensive frequency meter circuit is suitable for general use in small laboratories. It is cost-effective, easy to construct, and sufficiently reliable for most electronics enthusiasts. The frequency can be directly read from the meter, with a measurement range...
Wilf Rigter simplified this circuit a bit, made it phototropic, and doubled it up to yield a photopopper design in a post later the same day. I’ve got this design written up elsewhere in the library. The circuit described is...
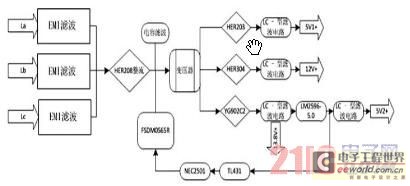
Currently, the switching power supply boasts high performance with an efficiency of 75%. The efficiency of single-scale integration switching power supplies has exceeded 90%. This advancement addresses energy concerns and enhances the performance of numerous energy-saving electrical devices. The...