
Filter For Audio Measurements

The Fletcher-Munson curves, also known as equal-loudness contours, illustrate the relationship between sound pressure level (SPL) and human hearing sensitivity across different frequencies. These curves demonstrate that human perception of sound intensity varies significantly with frequency, indicating that at lower SPLs, the human ear is less sensitive to low and high frequencies compared to midrange frequencies. This phenomenon necessitates the use of specific audio filters and equalization techniques to adjust sound output for more accurate representation, ensuring that audio signals are perceived as intended across varied listening levels.
In practical applications, this understanding is crucial for audio engineers and sound designers when calibrating audio equipment. For instance, when designing a sound system or creating music, it is essential to consider the Fletcher-Munson curves to adjust the frequency response of speakers or headphones accordingly. Implementing a multi-band equalizer can help achieve a balanced sound by compensating for the ear's reduced sensitivity at specific frequencies, particularly at lower SPLs.
To accurately model the Fletcher-Munson effect in a circuit, a combination of band-pass filters can be utilized to create a frequency response that mimics the equal-loudness contours. Each filter can be tuned to specific frequency bands (e.g., low, mid, and high frequencies) with variable gain settings that adjust based on the input SPL. This approach allows for a more nuanced representation of sound that aligns with human auditory perception, enhancing the listening experience across various volume levels.
Overall, the incorporation of the Fletcher-Munson curves into audio engineering practices underscores the importance of understanding human auditory sensitivity and its implications for sound reproduction in both live and recorded environments.The purpose is supposedly to account for the fact that human hearing is less sensitive at low and high frequencies than in the upper midrange, and that this variation is dependent upon the sound intensity (SPL). The Fletcher-Munson curve (as it is commonly known, and reproduced below) shows the variation, and it is clear that any loss of sensitivity is highly dependent upon the actual SPL.
The idea that a single filter can represent this at all levels is clearly wrong, but it is a standard nonetheless. (Interestingly, being wrong has never stopped a standard from being imposed, and this is probably truer in the audio industry than almost any other I can think of.)
The premise behind all this is that as the SPL is reduced, our ability to detect low or high frequency noise is reduced, so measurements should reflect this phenomenon. While it is undeniable that the chart above represents reality in terms of human heari 🔗 External reference
Related Circuits
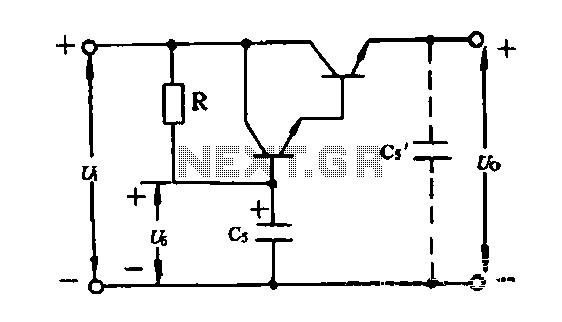
An electronic filter is utilized to enhance the filtering effect of capacitor C5. Capacitors in this configuration form a composite circuit with the electronic filter, as illustrated in the accompanying figure. The advantage of using smaller capacitors (5 to...
The circuit exhibits a flat frequency response ranging from approximately 20Hz to over 50kHz. The input sensitivity is set at 100mV for full-scale deflection on a 100µA meter. It is constructed using two common emitter amplifiers; the first stage...
This active subwoofer filter circuit is a 24 dB per octave filter with a Bessel characteristic and a cutoff frequency of 200 Hz. It is suitable for those experimenting with audio circuits in the subwoofer range, as all audio...
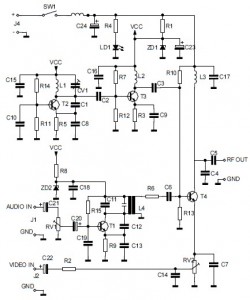
This is the circuit diagram of an audio/video modulator. The circuit converts audio and video signals into a UHF TV signal. It is designed to connect a video signal originating from a camera or other video source to a...

A 3D enhancement is required to achieve a fully three-dimensional sound experience for most stereo multimedia products. Typically, simple phase-delay circuits are utilized to create a widening effect on the perceived sound field. However, this approach can lead to...
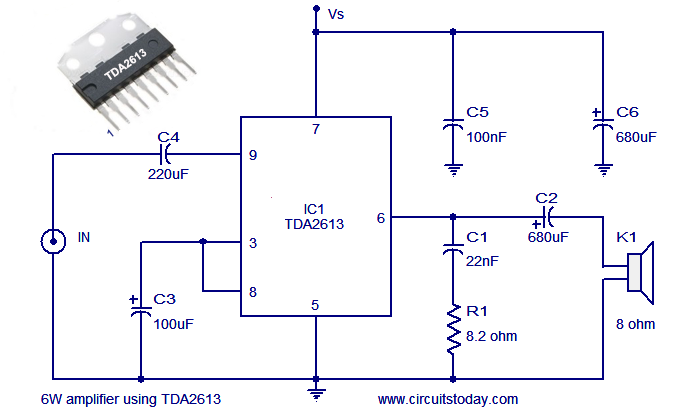
A simple and easy-to-build Hi-Fi audio power amplifier circuit is presented here. This 6-watt Hi-Fi audio amplifier circuit utilizes the TDA2613 integrated circuit (IC). The circuit design employs the TDA2613, which is a high-performance audio amplifier IC known for its efficiency...