
Injector Pulse Width Monitor with LM324 LM3914

The pulse width monitor circuit is designed to provide a visual indication of the injector pulse width in automotive applications. The core component, a transistor current source, ensures a stable charging current for capacitor C10, which serves as an integrator in this configuration. The linear voltage increase across C10 during the injector's on time allows for precise measurement of pulse width.
Upon deactivation of the injector, the stored voltage in C10 is transferred to C9, ensuring that the information from the previous cycle is retained for display. The choice of using a bar graph display (U3) allows for an intuitive visual representation of injector timing, with the LEDs indicating different ranges of pulse widths.
Potentiometer R31 plays a crucial role in setting the charge rate of C10, which directly influences the maximum pulse width that can be measured. This adjustability is vital for accommodating various injector types and engine configurations.
Calibration is a key aspect of ensuring accurate readings from the circuit. By using an oscilloscope and a waveform generator, the user can create a controlled input signal. The 62Hz square wave input, with a specific voltage and duty cycle, allows for consistent testing conditions. Monitoring the voltage across C10 helps to identify the point at which the voltage begins to flatten, indicating the maximum charge. Adjusting R22 ensures that the display accurately reflects the injector pulse width, allowing the user to correlate LED activation with specific time intervals.
The relationship between injector duty cycle and engine speed is critical for understanding engine performance. As the engine speed increases, the injector duty cycle will also vary, necessitating an accurate measurement system to optimize fuel delivery and engine efficiency. This pulse width monitor circuit thus serves as an essential tool for tuning and diagnostics in automotive applications, enabling precise control and monitoring of injector operation.The schematic for the pulse width monitor. The heart of the circuit is the transistor current source which charges cap C10 to form an integrator. The theory is that the cap is charged and the voltage across it increases linearly for the amount of time that the injector is energized.
As the injector is switched off the voltage in C10 is stored in c ap C9 and then C10 is reset to 0 volts to get ready for the next cycle. The output of the circuit is the voltage across cap C9, this voltage is fed directly into U3 the bar graph chip to be displayed as a value between 1-10 on the LEDs. Potentiometer R31 sets the charge rate on C10 and basically sets the max injector on time that can be displayed.
The calibration on this circuit is pretty tricky. You`ll need an oscilloscope and a waveform generator. Setup a 62Hz 0-12v 50% duty cycle square wave at the input to the circuit. Use the scope to monitor the voltage across C10 Adjust pot R31 such that the ramping voltage across C10 just reaches the peak (starts to flatten out). Now adjust the pot R22 in the display circuit such that LED 10 just comes on. With the calibration described above LED 1 corresponds to about 1. 5ms and LED 10 corresponds to about 8ms of injector pulse width (on time). Injector duty cycle in dependent on engine speed according to the following relationship: 🔗 External reference
Related Circuits

R1 controls the trip-point of the circuit. adjust it accordingly. to reverse the logic (have the led light up when the battery has at least X amount of power,) connect the led to ground through R4. More: all resistors...
A rectangular-wave pulse generator with an extremely long period can be constructed using only two components: a National Semiconductor LM3710 supervisor integrated circuit (IC) and a 100-nF capacitor to suppress noise spikes. This circuit leverages the watchdog and reset...
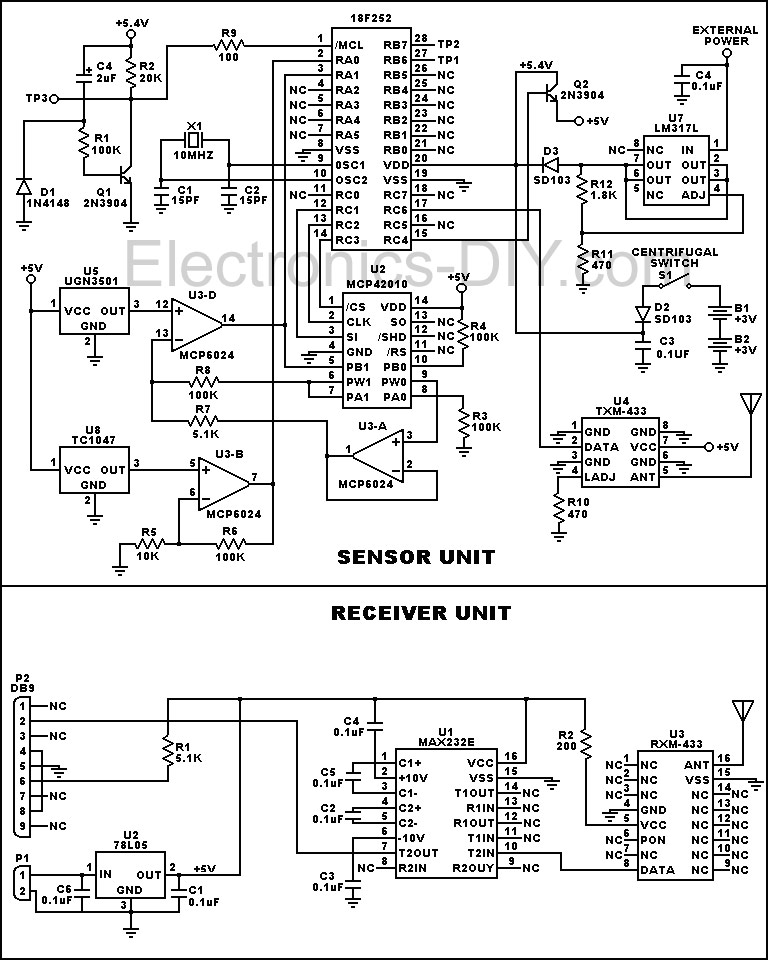
This device is designed to measure the torque in an automobile drive shaft and provide output to a vehicle data recording system or a portable computer via an RS-232 interface. The received data can then be combined with RPM...
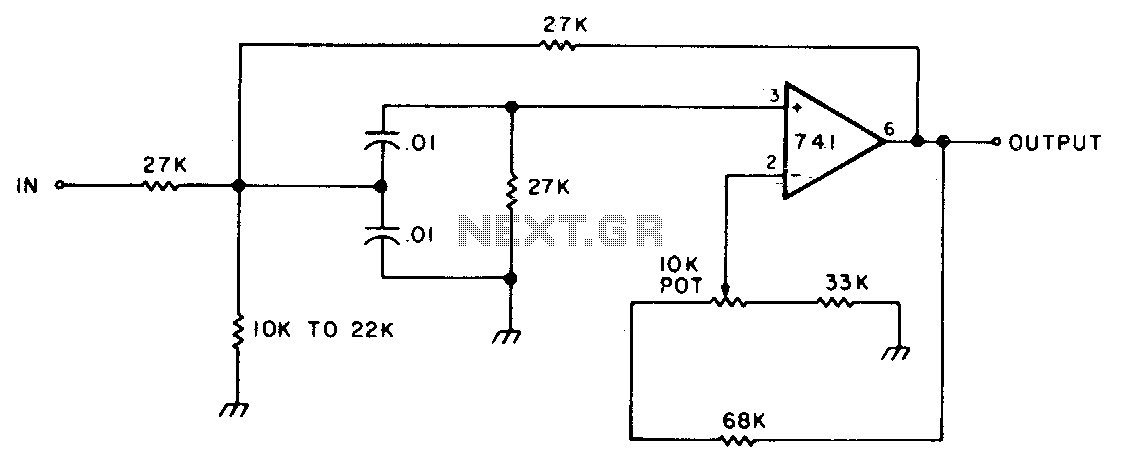
This circuit features adjustable bandwidth with a center frequency of approximately 800 Hz. A 10 kΩ potentiometer is used to adjust the bandwidth, varying from approximately ±350 Hz to ±140 Hz at the 3 dB down points. The circuit operates...
The circuit is conventionally designed with an eight LED audio level meter made from two low-power quad op-amps utilizing the LM324. Volume Unit. The eight LED audio level meter circuit serves as a visual representation of audio signal levels, providing...
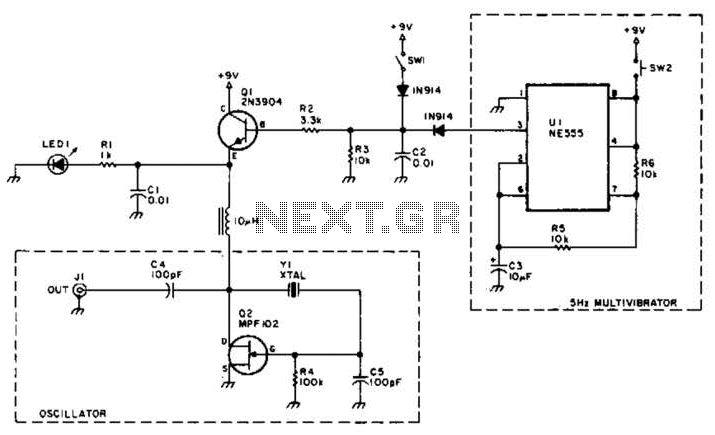
A useful marker oscillator can be constructed using an NE555 timer to generate pulses at an audio frequency. This design facilitates the detection of the signal even amidst interference. The crystal frequency can range from 1 to 30 MHz. The...