
Arduino Build LED weather station
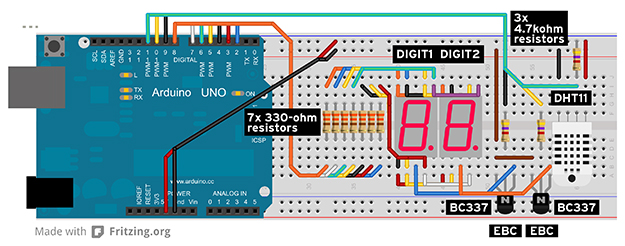
The multiplexing process is straightforward. To display a number on DIGIT1, output D9 is set high, sending current through a 4.7-kohm limiting resistor into the base of transistor Q1, activating it and pulling the common cathode pin of the display to ground, preparing the LEDs to light up. Data for that digit is then sent through the seven control lines (D2 to D8), illuminating the display. To show a number on DIGIT2, the process is reversed: D9 is set low to turn off Q1 and DIGIT1, while output D10 is set high to activate the second transistor for DIGIT2. The data is sent again through D2 to D8, lighting up DIGIT2. Although this may seem like a method to create flashing displays, the multiplexing speed is crucial; at a rate of 125Hz, the displays will appear continuously lit to the human eye.
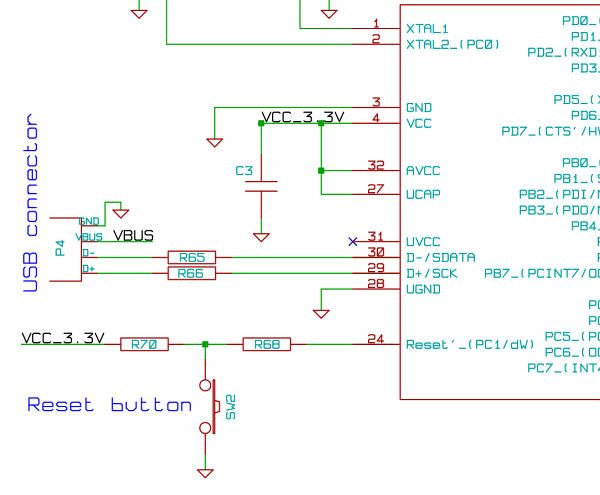
The weather station also incorporates a DHT11 sensor, which measures temperature and humidity. This four-pin device includes its own microcontroller, hygrometer, and negative temperature coefficient (NTC) thermistor that outputs data serially. The pin configuration for the DHT11 is as follows: with the label facing away and pins down, pin 1 connects to the power supply, pin 2 is the data pin, pin 3 is unconnected, and pin 4 connects to ground. The DHT11's data pin connects to Arduino data line D11, which is configured as an input to retrieve data.
Wiring is a critical aspect of this project; following the color coding on the wiring diagram is essential for proper connections. The circuit diagram serves as a reference, ensuring all components, including displays, transistors, and the DHT11 module, are correctly oriented. Dupont wires, often used in breadboarding, facilitate connections and can be sourced from various suppliers.
The Arduino will manage the retrieval of data from the DHT11 while simultaneously multiplexing the two seven-segment displays to prevent visible flashing. To streamline the process, open-source libraries will be utilized. The DHT11 uses a proprietary one-line data port, and the DHT11Lib library aids in managing this data efficiently. The Timer1 library, which utilizes the ATMEGA328P microcontroller's built-in timers, facilitates the creation of time delays. The Timer1 library also incorporates a timer overflow interrupt, allowing the microcontroller to execute specific code automatically when the timer reaches its timeout point. This interrupt system is used to maintain the multiplexed display at the correct rate, set at a prescaled delay of 8ms for a multiplex rate of 125Hz.
Data for the displays is organized in a two-dimensional integer array, where each row corresponds to a digit or character to be displayed. Each row contains seven numbers indicating the state of the seven segments, where a '1' signifies that a segment should light up, and '0' indicates it should remain off. When a specific digit is required, the corresponding row of the array is accessed, and the transistor controlling the display is activated. The data is sent to the outputs, illuminating the desired digit for 8ms before switching off. The variables digit1 and digit2 store the current display values, which are updated every 16ms, ensuring that the displays are refreshed quickly enough to appear continuously lit. The showNumber function simplifies the process of updating these variables by directly utilizing the temperature and humidity readings from the DHT11 sensor.In Part 2 of our Arduino masterclass we`re cracking on to build a weather station that measures temperature in degrees Celsius and relative humidity as a percentage. We`ll introduce new components and theory and put the lot into practice. LEDs on their own are great indicators but to display quantitative information we need something more and that
`s where seven-segment displays come in. These are blocks with seven LEDs arranged into a figure eight each individually controllable. As we described last previously LEDs have two connections: an anode (A) and a cathode (K). When current flows from anode to cathode the LED lights up. However to reduce the display pin count from 14 to 10 most displays have either all of their anodes or cathodes joined together to a single pin they`re known as common anode or common cathode displays. We`ll be using the LTS543R common cathode type they`re a garden variety display and the most complicated part of using them is knowing the pin layout.
Here`s how you do it: hold the display in front of you with the decimal point LED at the bottom-right. The bottom-left pin at the back is pin 1 counting right to pin 5 and the top-right pin is pin 6 counting left to pin 10.
To drive a seven-segment display you need seven data lines from an Arduino to control the seven LEDs. If you add a second display you`ll need another seven data lines. A third is another seven. So you can see the control pin count can skyrocket if we keep using this system. Our weather station uses two displays and while the Arduino Uno R3 has 14 outputs to play with we`re going to do it with just nine using a technique known as multiplexing.
Put simply it`s a way of being able to send data to different devices over the one set of control lines (data bus) using a time-share system. A simple analogy is driving your car: you (probably) don`t have your own dedicated roads you use the same roads as everyone else.
If you think of it in the time domain you`re time-sharing a road for the time you`re on it. What we`re doing is similar we`re multiplexing 14 LEDs` worth of data over a seven-bit data bus using a similar time-share method. We`re going to need another two control lines to make it work. This is also a good time to introduce you to another new component: the transistor. Your average Ivy Bridge-class Core i5 processor has 1. 4 billion of these things and we need just two. Transistors are clever little devices that can amplify a signal and act like controllable switches. In every case a transistor lets you control a larger current with a smaller one. If you follow the circuit diagram we`re using them as switches connected to the common cathode pin of each display.
The transistor in our circuit is a BC337 NPN medium-signal transistor. It`s a garden variety three-pin device and here`s how to tell the pins: hold the transistor flat-face facing you with the pins pointing down. The pin on the left is known as the collector (C) the pin on the right is the emitter (E) and the one in the middle is the base (B).
You could write two books on transistor theory but for now that`ll do. Left: The LTS543R seven-segment display. Middle: Pin-out for the BC337 NPN transistor. Right: Breadboard jumper wires like these make Arduino easier to use. So quickly here`s how the whole multiplexing thing works. When we want a number to appear on DIGIT1 we send output D9 high (meaning its voltage rises to the 5V supply rail). This sends current through the 4. 7-kohm limiting resistor into the base of transistor Q1 it activates and turns on. This pulls the common cathode pin of the display to 0V (or ground) to get the LEDs ready to light up.
We then send the data for that digit on the seven control lines D2 to D8 and the display will light up with the number. To display a number on DIGIT2 we do the reverse. We send data output D9 low which turns off Q1 and DIGIT1. We pull output D10 high turning on the other transistor which activates DIGIT2. We send the data on the outputs D2 to D8 again but this time DIGIT2 will light up. If you`re thinking this is pointless because all we end up with is two alternately flashing displays you`re dead right.
The trick is speed. Eyes are great at resolution but they can`t distinguish flashing objects much beyond about 75Hz. So if we can get this multiplexing speed up high enough you won`t see two flashing displays they`ll appear as though they`re continuously lit. And that`s exactly what we do in the Arduino code except that we push the multiplex rate up to 125Hz to make damn sure you can`t see it!
In the end we`re using nine data lines seven for the LEDs in each display and two to control the displays themselves. Hopefully you can see we only need one extra data line for every new display we then add. (Technically you can do the whole thing with just one data line albeit with a lot more electronics than we have here.
) That takes care of the display side of things but what about the temperature and humidity data That`s what the little DHT11 sensor provides. You can pick these up from eBay for under $3 or online from places like Australian Robotics with different pin-outs.
It`s basically a tiny four-pin brick with its own microcontroller a hygrometer and negative temperature coefficient (NTC) thermistor that outputs its data in serial form. To tell the pins hold the DHT11 in front of you pins down with the label facing away from you. The left pin is pin 1 and connects to the supply rail pin 2 is the data pin pin 3 is not connected and pin 4 is 0V.
We connect the DHT11 ²s pin 2 to the Arduino`s data line D11 which we configure as an input and grab the data using our Arduino code. That`s where we`re off to next. The wiring is the trickiest part of this project. Just make sure you follow the colour coding on our wiring diagram right as it identifies which wire goes to which pin without clogging up the diagram.
The circuit diagram will give you the reference point if you get lost. Keep checking things as you go. The displays transistors and DHT11 module must be installed the right way around or the project won`t work so again follow the overlay diagram carefully. If you`ve noticed the unusual wires we`ve used they`re sometimes called Dupont wires we bought ours from eBay (search for breadboard jumper cable for around $4 for 65 assorted lengths.
Alternatively grab an Arduino Experimenters Kit Jaycar has the Freetronics version (cat. number XC4262) for $90 or you can get a simpler version from Australian Robotics for $46. You`ll still need the extra parts in the parts list though. There`s a bit for our Arduino to do in this project. It has to retrieve the data stream from the DHT11 module and at the same time multiplex our two seven-segment displays fast enough to ensure we don`t see them flashing away. So rather than reinvent the wheel we`re going to use the help of others by incorporating a couple of open-source libraries to simplify some aspects of our project.
That said they only provide the nuts and bolts we still have to pull everything together to make this thing work which is what our sketch does. You can find the software for our weather station on the APC web site at apcmag. com/arduino. htm. Grab the weatherstation. zip` file unzip it copy the Timer1 ² and DHT` folders to your Arduino IDE`s library path (Arduino-1. 0. 1library) and create a apc_02_weather` folder for the apc_02_weather. ino` sketch file. The DHT11 uses its own proprietary one-line data port which unfortunately doesn`t follow any industry standards.
Thankfully we can use the DHT11Lib library to do the tough stuff. We`ve slightly modified the version included in the. ZIP file to add more precision to the error codes so we`re making it available under the GPL (General Public License). The library consists of two files: dht11. cpp` and dht11. h`. The other library we need is the Timer1 library. The Atmel ATMEGA328P microcontroller has three built-in timers (two 8-bit and one 16-bit) which you can preset to give you different time delays.
We`re using Timer1 the 16-bit timer. When you have a 16MHz clock rate and you`re only counting to 65536 (that is 216) it doesn`t take long. That`s why the ATMEGA328P also has a prescaler or divider to create longer delays (well up to 9 seconds anyway).
The Timer1 library makes this easier to do but also adds in a very useful feature called a timer overflow interrupt. Basically once the timer has reached its timeout point it fires off an interrupt signal to the microcontroller just like a three-year-old saying G ‚¬ fiiiiiniiiiiished!G ‚¬.
What`s useful about it is that we can attach the interrupt to a function or subroutine so that it automatically runs the code whenever the timer interrupt is fired. It`s this interrupt system we use to ensure that our multiplexed display runs at the right rate. We first set the prescaled delay to 8ms which means it fires off at a rate of 125Hz to get the multiplex rate above eye speed.
The next question is: what data are we sending to those displays At the front of the code is a long-winded two-dimensional integer array where each row represents a numerical digit from 0 to 9 followed by various characters we want to display; for example the degrees symbol percentage letters and the like. Each row contains seven numbers that correspond to each of the seven segments in the display: a 1 means we want a particular LED to light up while a 0 means we don`t.
So the way it works is if we want a 5 to appear on DIGIT1 we retrieve the data from row 6 of the array (arrays start at zero) and switch D9 high which flicks the transistor switch. We then send the data to outputs D2 to D8 and the display will light up for 8ms before switching off again.
It sounds slow to read it but in action you can`t see it. The data for each display digit is stored in two integer variables: digit1 ² and digit2 ². Because the displays are automatically updated every 8ms all we need to do is throw the right digit into those two variables and within 16ms (8ms for each digit) the numbers will appear on those displays. Wherever you see a digit1 = 10 ² or digit2 = 13 ² line in our sketch that`s exactly what we`re doing.
However since we get the temperature and humidity readings as two-digit integer values from the dht11. temperature` and dht11. humidity` functions manually setting digit1 ² and digit2 ² is clumsy. So to simplify things we`ve added the shownumber` function. It takes the data values direct from the dht11 ² functions and uses some simple maths functions to separate the digits and updates the digit1 ² and digit2 ² variables.
🔗 External reference
Related Circuits
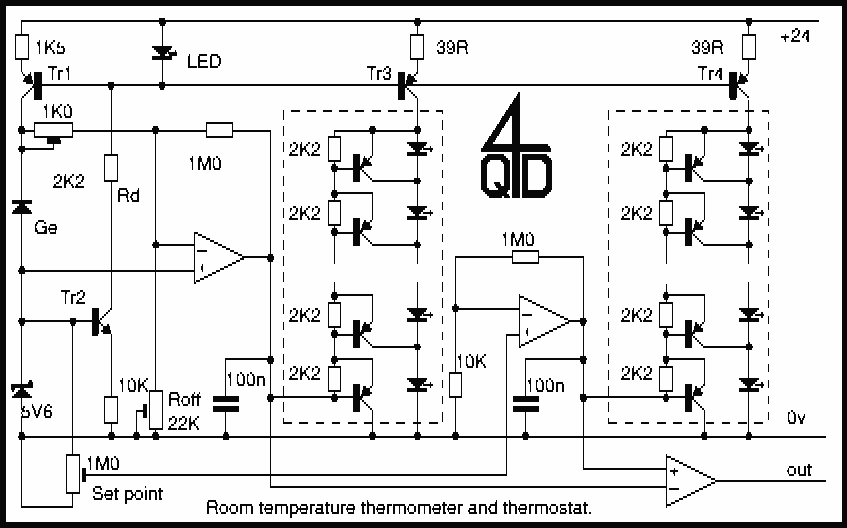
This circuit uses a germanium diode (marked Ge) as a temperature sensor. I used an OA90 diode but others should do. The 'ring' of Tr1 and Tr2 bias each other. Tr1's collector current is stabilized by the 5v6 zener,...
The drivers can operate fourteen LEDs, but only twelve are currently used. This allows for the addition of twelve LEDs to the existing setup without requiring additional drivers. The device is powered by a 120VAC plug, supplying power to...
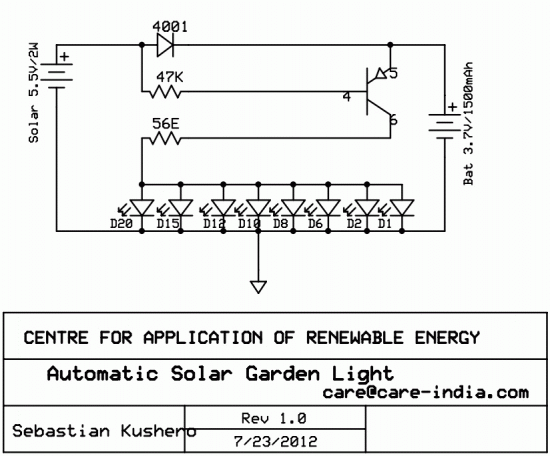
Efficient automatic solar garden lights circuit with minimal components. The advantage is that it operates completely automatically, with the solar panel serving as a light detector. The efficient automatic solar garden lights circuit is designed to provide illumination using renewable...
The microcontroller unit (MCU) will read images from the DataFlash memory via the SPI bus based on the known velocity. It will then send these images to the LED drivers using the SPI bus, controlling the on and off...
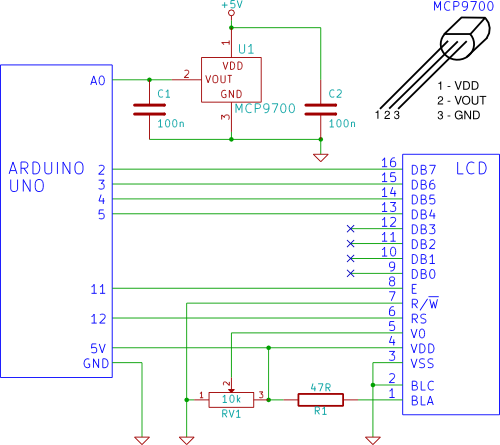
A temperature sensor (MCP9700 linear active thermistor IC) and LCD are connected to the Arduino in this tutorial. The Arduino reads the temperature from the MCP9700 on analog pin A0 and displays the temperature on the LCD. The circuit involves...
Program an ATmega1284P using an AVR Dragon and the Arduino IDE. The mighty1284p library has been installed, and after writing the sketch, it is compiled using the Arduino IDE. The compilation process creates a hex file in a temporary...