
FM demodulation with RLC circuits applet

The commercial FM demodulation process at an IF frequency of 10.7 MHz utilizes passive RLC circuits to convert FM signals into AM or PM signals, which are then demodulated via envelope detectors. The design of the demodulator includes first-order and second-order filters to ensure effective signal processing. The diode-RC combination functions as an envelope detector, though real-world performance may vary from the ideal case presented in simulations.
The demodulation process begins with the FM signal passing through a first-order system, generating an AM component that can be demodulated. The response of the system varies with frequency, leading to potential distortion in the output. To mitigate distortion, resonant frequencies and quality factors of the circuits must be carefully adjusted to maintain linearity across the FM bandwidth. The use of inductively coupled circuits allows for enhanced demodulation of wider bandwidth FM signals, showcasing the advantages of this approach over traditional methods.
The phase discriminator circuit operates effectively as a phase detector, producing a current that is applied to the circuit. The relationship between the currents and voltages within the circuit is crucial for accurate demodulation. The resulting output, when processed correctly, exhibits minimal distortion, which is essential for maintaining signal fidelity in commercial FM applications. This comprehensive understanding of the FM demodulation process, including the role of RLC circuits and envelope detection, is vital for the design and implementation of efficient demodulators in modern communication systems.Commercial FM demodulation is done at the IF frequency of 10. 7MHz. With a frequency deviation of ±75kHz, the deviation of the IF carrier is ±0. 7%. With this deviation, it is possible to convert the FM to AM or PM and AM using passive RLC circuits. The resulting AM is then demodulated with an envelope detector. Some basic FM demodulators are exam ined in the applet on this page. The possibility of converting a FM to an AM signal using first order RC and 2nd order Butterworth filters is first briefly examined. In the applet the Diode RC combination is assumed to be an ideal envelope detector. The practical envelope will be lower in amplitude and phase delayed compared to that shown in the applet.
The demodulators used here are shown below. Although some are no longer used, understanding them makes understanding the more complex ones easier. Fn = 1 shows the FM passed through a simple 1st order system. Because of the variation of the response with frequency, then the signal an AM component which can be demodulated.
In this case the output is small and distorted. Fn = 2 to 7 show special cases of Fn = 1. Image below show the case when the FM is centered at the frequency of maximum slope. Green shows an amplified version of the envelope. Fn = 11 is shown below. The signal at node 1 is shown in Yellow and its envelope in Green in the lower part of the image. The envelope is visibly distorted. Assuming the center frequency and BW of the FM are shown by the brown lines, then the resonant frequencies must be adjusted as shown below. The difference between the two responses is shown by the blue magenta curve. Both the resonant frequencies and Q`s should be adjusted so the blue magenta line is linear over the BW of the FM.
The LS1-C1 response is shown by the green to blue resonant peak and the signal at 3 is shown by the blue curve at the top. Assuming ideal envelope detectors, then the signal at 4 is shown by the light magenta curve at the bottom.
The freq response of the lower LS2-C2 resonant circuit is shown by the yellow to green curve at the bottom, the time response by the yellow curve at the top and the envelope at 5 by the orange curve at the bottom. When the orange curve is inverted and added to the light magenta one, the result is shown in green. Compared to the single resonant circuit the output is much less distorted. A measure of the distortion is shown by the magenta curve which plots the output vs the mod signal. The image below shows what happens when the resonant frequencies are not separated enough. Severe distortion results as indicated by the `S` curve in magenta. Red is the FM signal which is applied to the primary. The primary and secondary form a pair of inductively coupled circuits both tuned to the center frequency of the FM.
The magnitude and phase of the coupled circuit response are shown by the red to green and cyan lines. Kc is the coupling coefficient expressed in terms of the critical coupling. The envelopes at 7 and 9 are shown by the orange and blue magenta plots and the signal between 7 and 9 is shown as the green signal which follows the dark green modulating signal at the top.
It is not uncommon to see descriptions of the functioning of the phase discrimmator using only the secondary circuit. This approach can illustrate the basic functioning of the circuit but it does not show the property of being able to demodulate wider BW FM than can be done by other RLC circuit demodulators.
This is a simpler version of the RLC circuits above. The resonant circuit is tuned to the center frequency of the FM and the circuit is effectively a phase detector. A current produced by the FM is applied at 10. The image below show the signals in the circuit. red and orange are the current through L1 and the voltage across L1 and blue is the voltage across R2L2C2.
The product of the 2 voltages is in yellow and the envelope (or average) of the yellow signal is shown in green which follows the modulating signal. freq devn/carrier freq is ~ 1% just about sufficient for commercial FM. Image below illustrates this approach. FM is in red, modulating signal is in blue, phase shifted carrier is in cyan and the product of phase shifted carrier and the FM is in yellow.
The envelope or average of the yellow is in green which follows the blue modulating signal. 🔗 External reference
Related Circuits
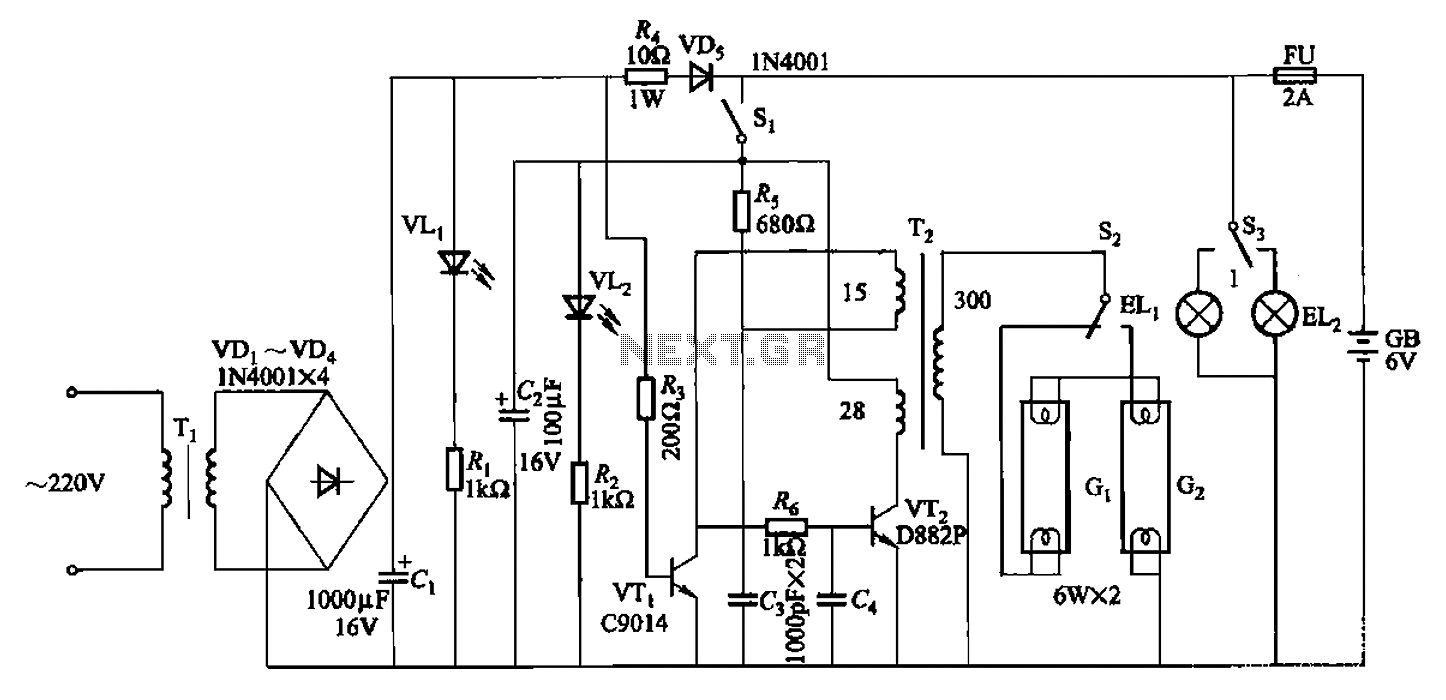
The 786A multi-functional double-tube fluorescent emergency circuit is illustrated in Figure 2-129. This circuit shares similarities with Figure 2-125. The 786A multi-functional double-tube fluorescent emergency circuit is designed to provide illumination during power outages or emergencies. It utilizes two fluorescent...
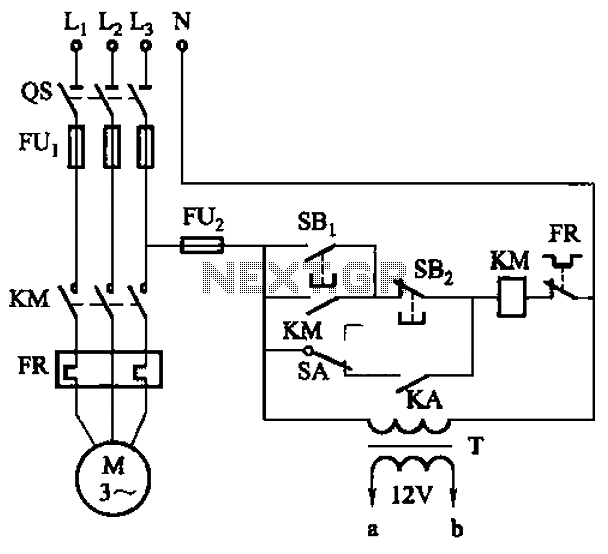
The circuit illustrated in Figure 3-81 employs a transistor delay circuit to facilitate start-stop cycle control. It can operate in both manual and automatic modes. The circuit is primarily governed by the motor run time circuit, which includes transistors...
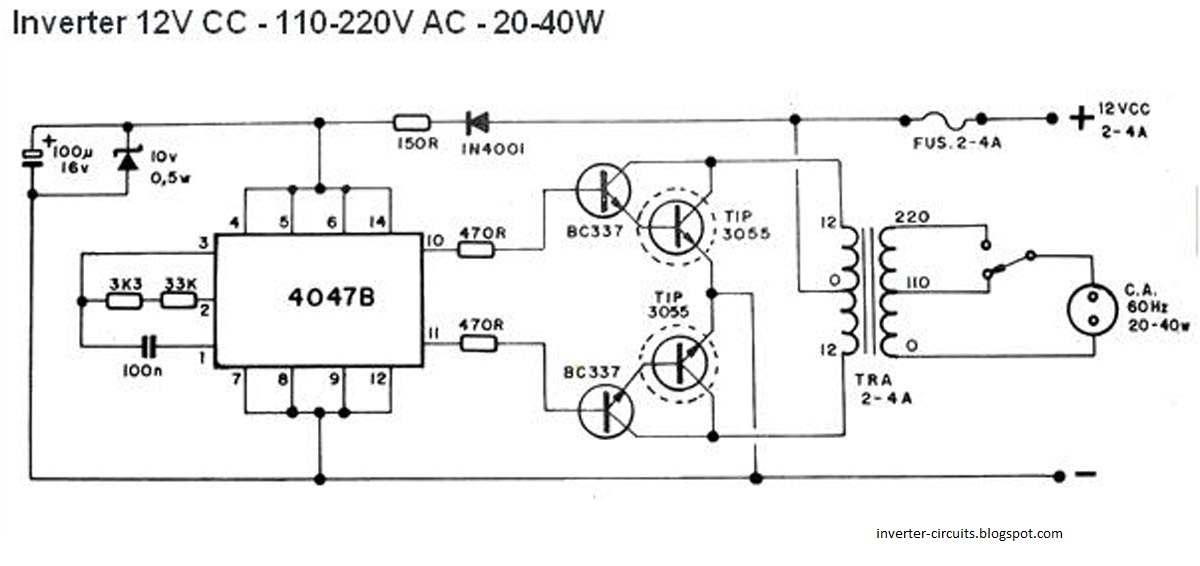
This schematic represents a simple 40W inverter that converts 12V to 220V. It has been functional for four years. The core component of the circuit is a CD4047 integrated circuit (IC) configured as an astable multivibrator. The resistance and...
It was observed that balls were becoming lodged in the ball trough, failing to load into an upkicker or not resting correctly on the trough ball microswitches or optos, which caused the machine to register a missing ball. Initially,...
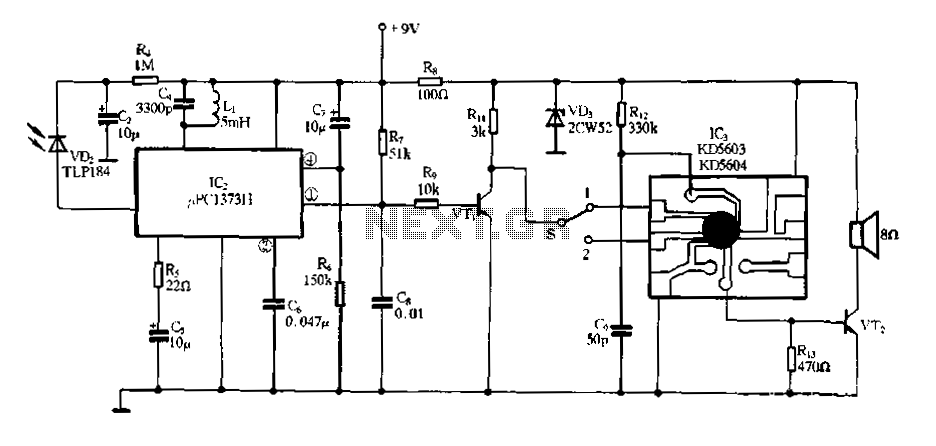
Electronic Miss Manners infrared receiver and voice circuits The Electronic Miss Manners system integrates an infrared (IR) receiver with voice circuits to facilitate communication and interaction. The IR receiver is designed to detect signals emitted from a remote control or...
Basic information on the construction of various types of lasers from scratch, including topics such as home-built laser safety, setting up a home laser lab, sources of supplies and chemicals, vacuum systems, glass working, structural materials, power supplies, and...
Warning: include(partials/cookie-banner.php): Failed to open stream: Permission denied in /var/www/html/nextgr/view-circuit.php on line 713
Warning: include(): Failed opening 'partials/cookie-banner.php' for inclusion (include_path='.:/usr/share/php') in /var/www/html/nextgr/view-circuit.php on line 713