
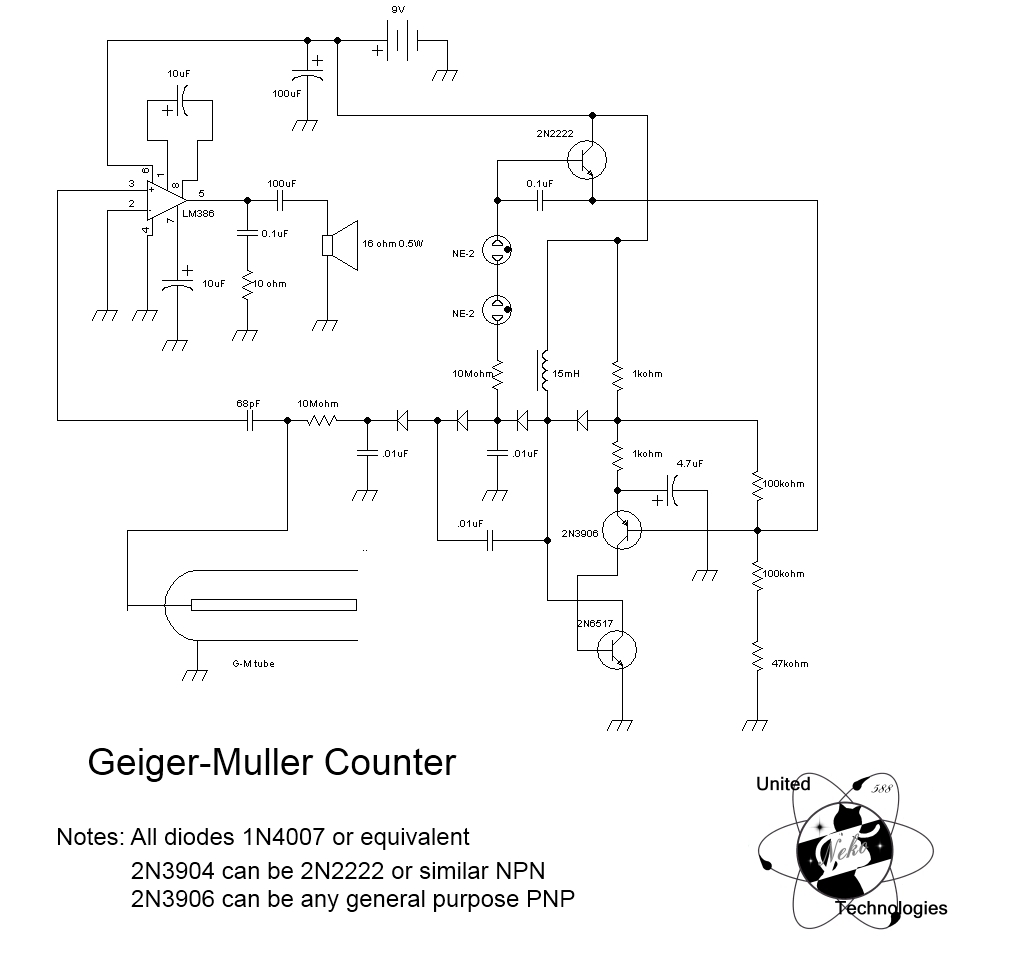
Geiger counter

The Geiger-Müller (GM) tube is a crucial component in radiation detection and measurement applications. Its operation relies on the ionization of gas within the tube, which occurs when ionizing radiation enters and interacts with the gas atoms. The design of the GM tube facilitates the efficient collection of ion pairs, which is essential for generating detectable signals. The cylindrical cathode and central anode create a uniform electric field, ensuring that the electrons produced by ionization are directed towards the anode.
The quenching gas plays a vital role in preventing continuous discharge and ensuring the tube can reset after each detection event. Without this quenching mechanism, the tube could enter a state of continuous conduction, rendering it ineffective for further measurements. The integration of the power supply and counter into a single unit simplifies the experimental setup, allowing for streamlined operation and data collection.
The statistical analysis performed during this experiment provides insights into the behavior of ionizing radiation and the response of the GM tube under varying voltage conditions. By systematically varying the voltage and recording the counting rate, one can observe the characteristics of the GM plateau, which is indicative of the tube's operational efficiency. The relationship between voltage and counting rate reveals essential information about the tube's performance and the underlying physics of ionization processes.
The use of an oscilloscope in conjunction with the GM tube enhances the understanding of pulse formation and allows for real-time observation of the detection events. This visual feedback is invaluable for interpreting the results and understanding the dynamics of the ionization process.
Overall, this experiment not only demonstrates the principles of radiation detection but also reinforces the importance of statistical methods in analyzing experimental data, contributing to a deeper understanding of the behavior of ionizing radiation and the performance characteristics of GM tubes.This experiment has two main objectives. First, we will become familiar with the characteristics of the Geiger-MG ller (GM) tube, including the properties of threshold, starting and operating voltages, GM plateau region and plateau slope. Then we will use the GM tube to perform a simple statistical experiment for the purpose of studying some of th
e techniques of statistical analysis. The basic GM circuit diagram is shown in Figure1. The power supply and counter are one unit. The GM tube itself consists of a cylindrical outer shell which serves as a cathode and is grounded. In the center it has a coaxially mounted wire serving as anode. The cylinder is filled with an inert gas (typically Argon) at low pressure plus a small amount of ``quenching`` gas (e. g. ethyl alcohol). A DC power supply provides a voltage across the tube in the range of a few hundred to over a thousand Volts depending on the requirements of the particular tube.
Caution: The front window of the tube is very thin and delicate and should not be touched. Radiation entering the tube can ionize some of the gas atoms, thereby freeing electrons which are accelerated towards the central wire by the electric field and gaining enough energy to cause further ionization. The result is a ``cascade`` or ``avalanche`` effect which produces a current pulse through the tube. This current pulse causes a voltage pulse across resistor R, which is used to trigger a counting device that records the number of pulses.
We are thus able to count the number of ionizing particles entering the tube. There is, however, no information about the initial particle energy. An oscilloscope is connected to the system to allow us to visually observe the pulses from the tube. The purpose of the quenching additive to the gas is to effectively absorb UV-photons emitted from the electrodes when the ions produced in the multiplication process impact on the electrodes. Such photons may otherwise liberate secondary electrons (via the photo-electric effect) which may initiate the avalanche process all over again, thereby leading to catastrophic breakdown of the tube (i.
e. a spark). Place a radioactive source near the GM tube. Note the operating voltage listed on the tube. Make an exploratory study of the effect of turning up the voltage across the tube. Do not exceed the operating voltage by more than about 100V! Note the appearance of the pulses on the oscilloscope and the behaviour of the counter. Systematically increase the voltage in steps of about 50V, starting at 500V. Decrease or increase the step size as necessary to see the shape of the curve you are graphing. For each voltage setting, record and plot the counting rate (counts/second or Hz) and the pulse height as seen on the oscilloscope. Determine the GM ``threshold voltage``, i. e. the voltage at the beginning of the GM plateau. Also measure the slope of the plateau (increase in counting rate per 100V). Arrange a source to give about 5-6 counts per 10sec interval (perhaps room background will give you sufficient counting rate).
Record the number of counts N per 30sec interval for as many intervals as you can. Plot the number of counts per 30sec interval as the abscissa and the number of times that number of counts occurred as the ordinate of a graph. The number of electron-ion pairs collected when a charged particle traverses a gaseous counter of average size, plotted against the voltage applied between electrodes.
The curves are for a-particles (He nuclei) and b-particles (electrons). Note the three regions of operation as an (I) ionization counter, (II) proportional counter, and (IV) Geiger-MG ller counter. Determine the mean number of counts
🔗 External reference
Related Circuits
The material is presented as a teaching tool aimed at enhancing understanding and interest in the design of counters. According to R. S. S. Obermann, the design of counters serves as an excellent proving ground for individuals who have...
The basic charging circuit generates over 500V, depending on the inductor, component leakage, and other factors. The current output is limited by a 10 MΩ resistor, maintaining a short-circuit current under approximately 60 µA, making this project relatively safe....
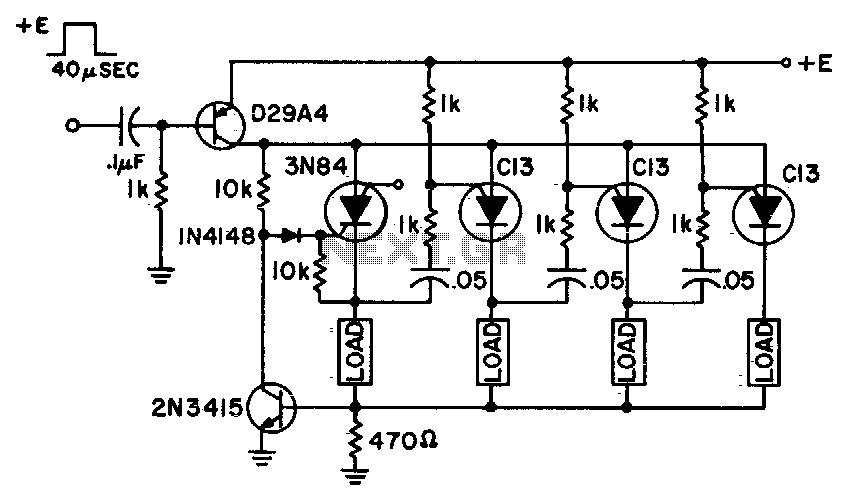
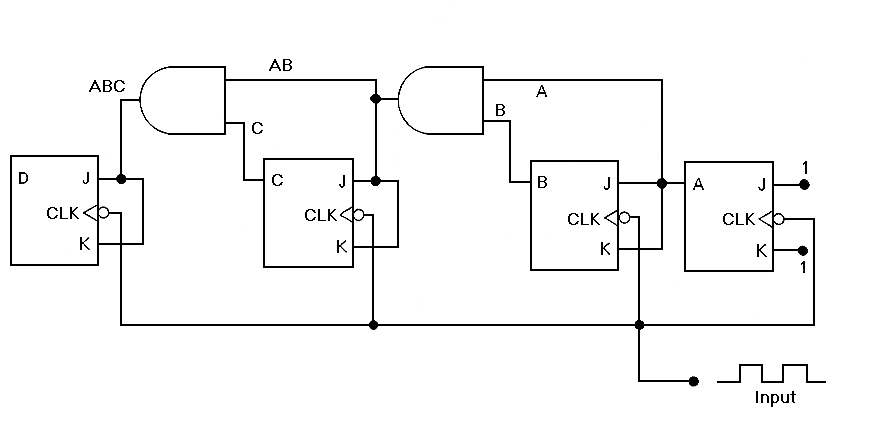
This ring counter creates an efficient, low-cost circuit that features automatic resetting through the first stage 3N84. Additionally, it allows for cascading as many stages as desired. The ring counter is a type of sequential circuit that consists of a...
After receiving a Micro Scalextric set for Christmas and acquiring a large quantity of second-hand track from eBay, a lap counter was deemed necessary for racing against the clock and opponents. The objective was to accurately time laps, rather...
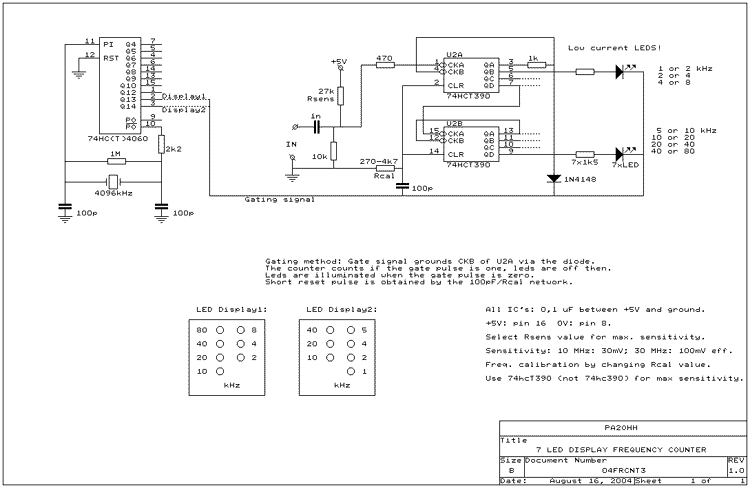
Alternative display methods exist beyond the original 8 LED frequency counter, potentially offering improved readability and a more suitable format for QRP equipment. This document presents examples of binary decimal displays. Typically, the counter omits the MHz position, focusing...
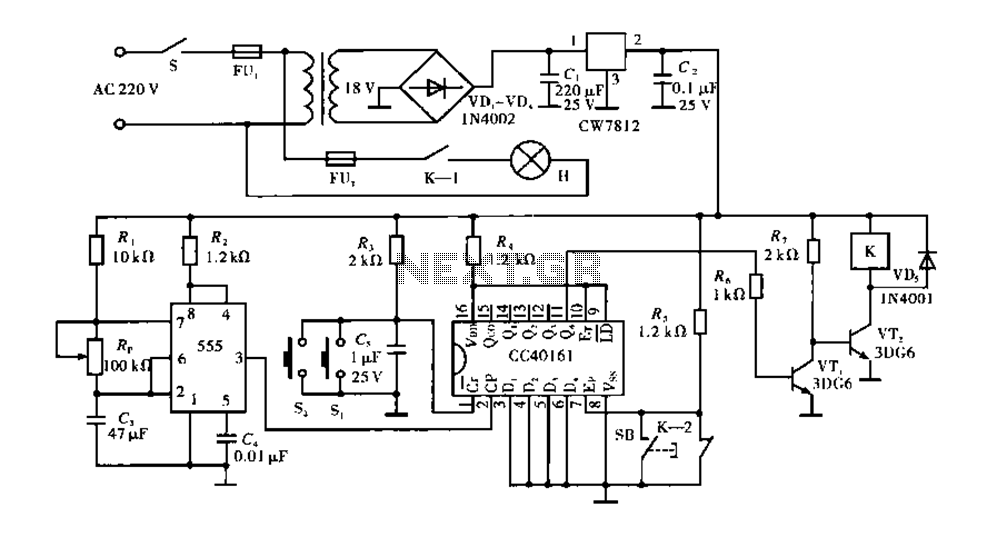
Corridor counter delay circuit for controlling lights. This circuit is tested and functional. When the circuit is energized, the 555 oscillator starts to oscillate. The CC40161 is cleared, and an integrating circuit composed of R3 and C5 transitions the...