
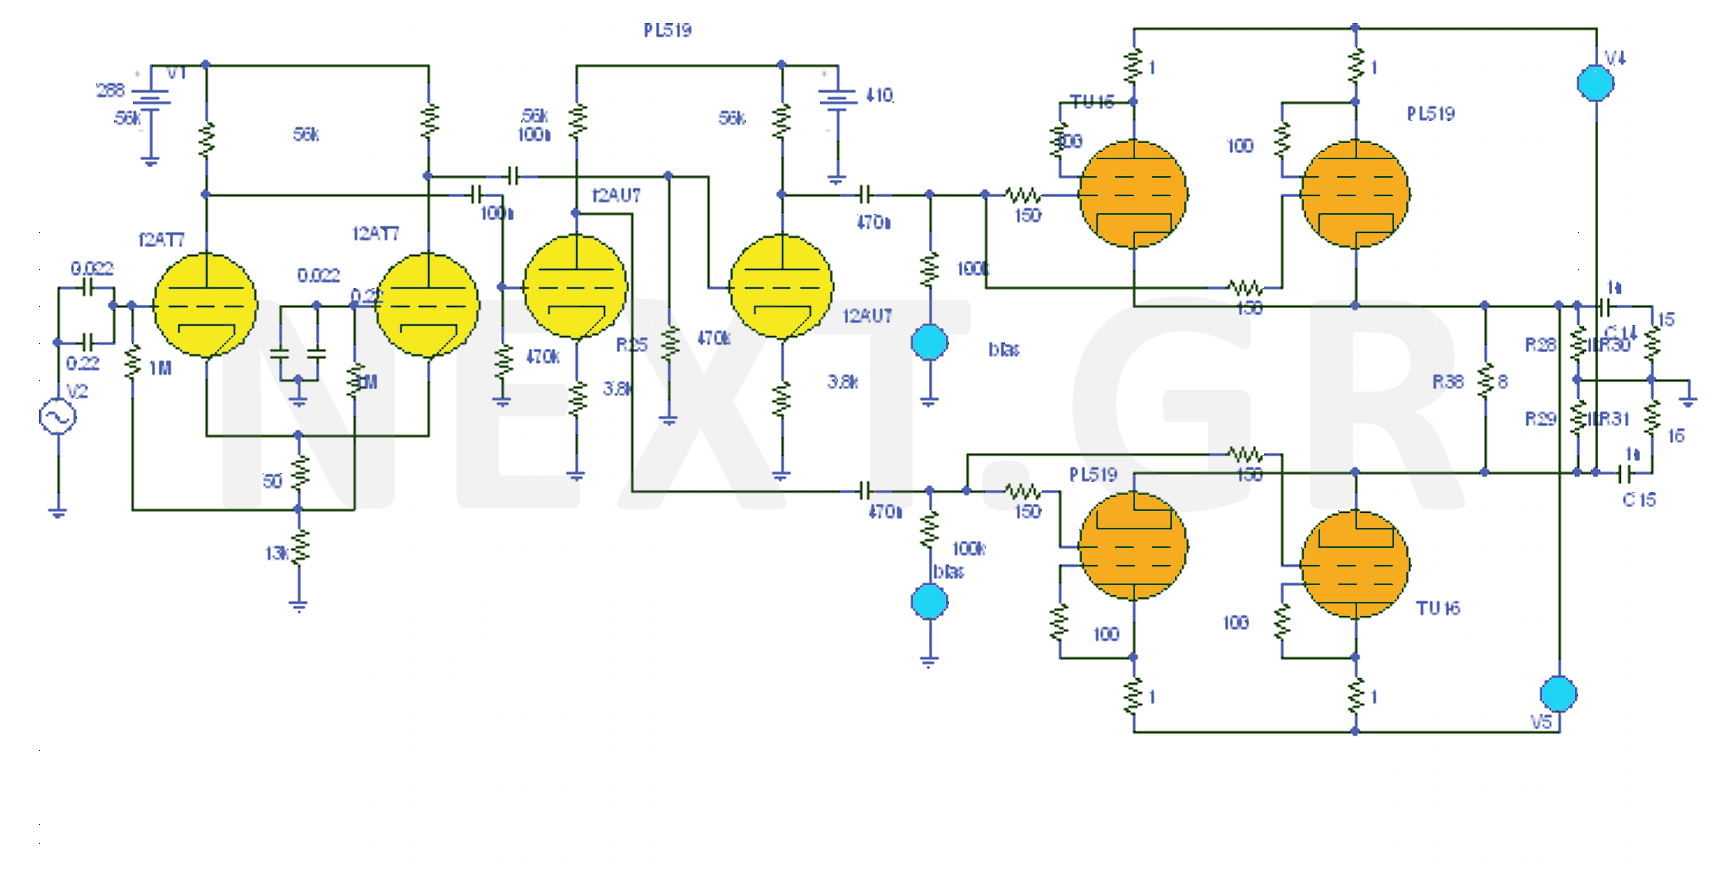
High Fidelity Valve audio Amplifier 40W
Transistor amplifiers prominently exhibit the third harmonic, which tends to produce a "covered" sound, resulting in limited quality during recording or playback. In contrast, valve amplifiers generate a full range of harmonics—particularly the second, third, fourth, and fifth—contributing to a rich, bronze sound. As an amplifier approaches saturation, higher harmonics are amplified, enhancing the overall sound volume. While valves impart a unique coloration to sound, other components are capable of providing greater fidelity in reproduction and recording.
The Amplifier Circuit
Given the known power, calculating the maximum current value on a resistive load, such as a speaker, is straightforward. From the following relationship, the peak current can be determined:
I_peak = √(2 * Watt * R) / R
In this scenario, the maximum current is 3.08 A. There are guidelines that dictate the number of output valves necessary for safe operation without compromising their lifespan. For instance, the PL519 valve, which can withstand a maximum cathode current of 0.5A (though it can tolerate currents exceeding 1A), necessitates dividing the required output current by the maximum allowable current. This results in the need for six output valves or three pairs. If fewer valves are preferred, either the current requirement must be reduced, or more valves can be utilized. Operating with fewer than four valves is deemed unsafe.
The RMS value of the output voltage can be calculated using the formula:
P = V_rms * I_rms => V_rms = P / I_rms
The RMS value is given by the maximum of:
√2 * V_rms = 38 / 2.18 = 17.4V_rms, V_peak = 24.6V, V_p-p = 49.2V. This indicates that each cathode with respect to ground should exhibit a 24.6V ripple. This value is crucial, particularly in the absence of V_g-Ik features with anode trend changes, which are challenging to derive reliably. The relationship V_a(t) = V_s - V_k(t) holds, where V_s represents the supply voltage.
The biasing point is set at 170V, 0.2A, -30V. The output load comprises an 8Ω resistance in parallel with a 360Ω resistance, yielding an approximate 8Ω load. The slope as a load line is relatively small, calculated as -1 / R_k = -1 / 8 = -0.125. The load line equation is y = 8x + 168.4, shifted to the axes origin at (168.4, 0). By calculating the polar points, the dynamic characteristics of rp, mu, and gm can be indirectly determined through the gain ratio and the required ripple voltage.
The values are as follows:
Rp = (190 - 126.6) / 0.35 = 181
Mu = 4.35
Gm = mu / rp = 4.35 / 181 = 0.024 = 24mA/V
From the relationship for voltage gain:
A_v = (mu / (mu + 1)) * (R_k / (R_k + (rp / (mu + 1))))
The maximum required grid voltage to derive this descent voltage (A_v = 0.155) can be calculated. Knowing V_p required at the output and having calculated the gain of this stage, the relationship α_v = V_p / V_g can be utilized to determine V_g, where V_g is the peak voltage of the input signal.
Results
The results are displayed for the entire amplification device, starting from the input stage. Table 1 summarizes key features of the input and driving stages. The overall gain of both stages is A_v = 110. Although the boosting capacity of the stages is higher, the low selection option was implemented to provide the necessary voltage at the input of the output stage without issues.
Table 1 Key features of the entry and driving stages
| Feature | Entry | Driving Stage |
|-------------------------|-------|---------------|
| Rise Resistance | 56K | 56K |
| Anode Voltage 1 | 178V | 250V |
| Anode Voltage 2 | 168V | 250V |
| Anode Current 1 | 2.39A | 2.68A |
| Anode Current 2 | 2.57A | 2.68A |
| Cathode Resistance | 100Ω | 3.8K |
| Voltage Gain | 20 | 5.5 |
| Gain Rate | 60 | 16 |
Table 2 presents the main features of the output stage as selected in the final topology.
Table 2 Key characteristics of the output stage
| Feature | Output Stage |
|-------------------------------------|--------------|
| Internal Impedance (ra) | 270Ω |
| Output Impedance (theoretically) | 27Ω |
| Output Resistance (practically) | 27.5Ω |
| Gain Factor (mu) | 5 |
| Voltage Gain (no load) | 0.6 |
| Voltage Gain (with load) | 0.136 |
| Coefficient Transconductance gm mA/V| 20 |
The output resistance value is deemed unacceptable and necessitates the application of negative feedback to enhance the amplifier's performance. This requirement is supported by measurements related to harmonic presence in the output. In the case of a Class A amplifier, harmonics beyond the third can typically be disregarded. In push-pull amplifiers, the third harmonic is predominant, while in Class AB amplifiers, higher harmonics become more pronounced, with noticeable effects up to the 25th harmonic.
Perceived harmonic distortion is 0.7% for music and 0.9% for speech at a frequency range of 15,000 cycles, with a pendulum as the output lamp. At 3,750 cycles, these values are 1.1% and 1.5%, respectively. The tolerable distortion levels at these frequencies are 1.35% for music and 1.9% for speech at 15KHz, while at 3.75KHz, they are 5.6% and 8.8%, respectively. The amplifier exhibits favorable performance concerning distortion. Feedback is also deemed necessary to minimize distortion phenomena, which primarily manifest as linear distortion. The amplifier demonstrates a frequency range of 25Hz to 65KHz without apparent disturbance when analyzing square waves.
Improvements
From a practical standpoint, the transformer must be redesigned to include windings for the second channel. The current windings for the power sources and high voltages of the circuit breaker and its thread are no longer necessary. Transformer wiring can be consolidated. A carefully designed power supply, without stabilization at the output—found to be unnecessary—would allow for a reduction in the size of the transformer, benefiting both channels. Proper calculations of the required trends are essential for this optimization.
In terms of output, the voltage required for the proper biasing of the output is reduced by 50 volts, contributing to a decrease in transformer size. Additionally, the AC coupling of stages eliminates the need for the 400V voltage in the second stage. Both initial stages can share the same power supply trend. Careful selection of components, particularly for voltage stabilizers requiring higher current resistance, will also contribute to reducing the overall size and cost of the amplifier.
Furthermore, an appropriate arrangement of components within the chassis can yield significant thermal advantages, including disconnection of wiring to prevent potential issues such as short circuits. This design consideration can also enable the installation of a complete stereo amplifier within a compact chassis.
Overall, enhancements to the amplifier design can be tailored to meet the specific requirements of each manufacturer, focusing on factors such as size, performance, sound quality, appearance, and cost.The design of the 40W Valve Amplifier is shown in the figure. In valve amplifiers the predominant feature is the strong presence of the second and third harmonics, sometimes in agreement with the fourth and fifth, but always with a much wider width. Higher harmonics of the fifth are not significant until the overload exceeds 12dB. The significant difference in valve amplifiers is the alternation of the position of the second and third harmonics. In amplifiers with transistors the distinctive feature is the appearance of the third harmonic element.
All other harmonics are present, but with much less width than the third one. When the overload reaches the cut-off point, all higher harmonics begin to grow, in width, at the same time. This point is generally between 3-6dB of 1% of the third harmonic. There is a close relationship between electronic deformation and musical coloring. This is also the real key to the difference in acoustics between valve amplifiers and transistors. Perhaps the most knowledgeable in this area is musical instrument manufacturers. Through chronic experimentation, they can determine how harmonics affect the tone of the instrument.
Transistor Amplifiers strongly show the presence of the third harmonic. This harmonic as reported produces a "covered" sound, giving the recording or playback a limited quality. Instead, the lamps produce a whole range of harmonics. Especially, as already mentioned, the second, third, fourth and fifth, have a noticeable presence, giving a bronze sound.
As long as an amplifier enters the area of ​​saturation, both higher harmonics are amplified, giving volume to the sound. The valves color the sound while the other elements can give more reproduction and recording fidelity.
The Amplifier Circuit
While the power is known, it is very easy to calculate the maximum current value on a resistive load such as what we theoretically take into account as a speaker.
From relationship 2 we have
Ipeak = √(2 • Watt • R) / R
The maximum current in our case is 3.08 A. There are also some rules that determine the number of output lamps required to operate safely and do not shorten their lifetime.
In the case of PL519, because the maximum cathode current it can withstand is 0.5A (although it can withstand currents larger than 1A), what we need to do is to divide the required current of the output with the maximum current. , Ie in this case 6 output lamps or three different pairs. If we do not want to use so many lamps, we reduce our requirements or we use as many as we want. In this case under four it will not be safe for the lamps. From relation 3 we calculate the rms value of the output voltage.
P = Vrms • Irms => Vrms = P / Irms
The rms value is given by the maximum of √2 Vrms = 38 / 2,18 = 17,4Vrms, Vpeak = 24,6Volt, Vp-p = 49,2Volt.
That is to say, every cathode with respect to earth should have 24.6 volt ripple. This value is extremely important if there are not Vg-Ik features with anode trend changes (which are particularly difficult to derive from the programs and are reliable). These graphs for PL do not exist. Using the cathode ripple in Va-Ik. Because of the vVa device, it is altered by the cathode ripple. For each time, Va(t) = Vs-Vk(t) is valid. Where Vs is the supply voltage.
The polarization point is 170V, 0.2A, -30V. The output load is the resistance of 8Ω parallel to the resistance of 360Ω, ie approximately 8Ω.
This slope as load line is too small -1 / Rk = -1 / 8 = -0.125. The load line is y = 8x + 168.4 and is shifted to the beginning of the axes at (168.4, 0). By calculating the polar points, the dynamic characteristics of the rp, mu, gm can be calculated indirectly by the gain ratio and the ripple voltage required.
Rp = 190-126.6 / 0.35 = 181
Mu = 4.35
Gm = mu / rp = 4.35 / 181 = 0.024 = 24mA / V
From the relationship for the downfall gain
Av = (mu/mu+1) • (Rk / (Rk + (rp/mu+1))
We calculate the maximum value of the grid voltage required to derive this descent voltage (Av = 0.155).
Knowing the Vp we require at the output and having calculated the gain of this stage, we can find very simply from the relation Αv = Vp / Vg, where Vg is the peak voltage of the signal in the pen, the voltage Vg. This is also the trend of rippling the rise of the second stage. The gain of the second stage can be calculated either by first calculating the gain of the input stage (once the maximum input value is known) or by selecting a reasonable profit value.
Results
The results are then shown on the whole reinforcement device, starting from the entry stage.
Table 1 summarizes the results of the key features of the entry and driving stages.
The overall gain of both stages, as an important feature, is Av = 110. The boosting capacity of the stages is much greater, but as mentioned above the low selection option was forced to provide the voltage at the inlet of the output stage without showing Problems.
|
Entry |
driving stage |
|
|
Rise resistance |
56K |
56K |
|
Anode Voltage 1 |
178V |
250V |
|
anode voltage 2 |
168V |
250V |
|
Anode current 1 |
2.39A |
2.68A |
|
Anode current 2 |
2.57A |
2.68A |
|
Cathode resistance |
100Ω |
3.8K |
|
Voltage gain |
20 |
5.5 |
|
Gain rate |
60 |
16 |
Table 1 Key features of driving and driving stages
Table 2 shows the main features of the output stage as selected in the final topology.
|
Output stage |
|
|
Internal impedance (ra) |
270Ω |
|
Output impedance (theoretically) |
27Ω |
|
Output resistance (practically) |
27.5Ω |
|
Gain Factor (mu) |
5 |
|
Voltage Gain (no load) |
0.6 |
|
Voltage Gain (with load) |
0.136 |
|
Coefficient transconductance gm mA/V |
20 |
Table 2 Key characteristics of the exit stage
As is proven and practically the value of the output resistance is unacceptable. The requirement to apply negative feedback is now necessary for the best possible performance of the amplifier.
This is confirmed by the measurements presented in Table 5 concerning the occurrence of harmonics in the output. It should be borne in mind that in the case of a class A amplifier, the effect of harmonics higher than the third can be ignored.
In Push-Pull amplifiers the third is the main one. In AB amplifiers the higher harmonics grow more and the unnecessary up to the 13th are noticeable and up to the 25th can be appreciated.
The perceived harmonic distortion from the ear is 0.7% in music and 0.9% in speech, in a frequency range of 15000 cycles and with a pendulum as an exit lamp.
At 3750 cycles these values ​​are respectively 1.1% and 1.5%. The tolerable deformation at these frequencies is for 15KHz 1.35% for music and 1.9% for speech, while 3.75K is 5.6% and 8.8% respectively.
The effects of the amplifier are very optimistic in terms of distortion. Feedback is also considered necessary to reduce the deformation of the fittings, which is essentially a form in which linear deformation occurs (as expected). A good element displayed by the amplifier was the frequency range 25Hz-65KHz.
The study of the deformation using square wave showed no apparent disturbance, and no other form of deformation occurred until the voltage amplification stages.
Improvements
From a practical point of view, the transformer must be redesigned and include windings for the second channel.
Besides, the current windings for the current sources and the high voltages of the circuit breaker and its thread are no longer used. Transformer wiring can go on one side. With a careful design of the power supply and no stabilization at the output, which turned out to be unnecessary, for both channels only half the board would be needed.
Careful design means correct calculation of the required trends.
As in the case of the output where the voltage we need for correct polarization of the output is 50 volts less, thus helping to reduce the size of the transformer. Also, due to the AC coupling of stages, the 400V voltage in the second stage is not required. Both initial stages can be fed with the same trend. Correct selection of components as in case of voltage stabilizers (higher current resistance requirement).
All of the above helps to reduce the size of the transformer, amplifier, and cost.
Also a correct arrangement of the components in the chassis can yield a lot of gains from the thermal point of view, disconnection of the wiring to avoid problems and doubts about a possible omission or a short circuit but also a chassis of the same size to install a whole stereo amplifier.
Designs for the two amplifier are the necessary moves to improve its performance and minimize deformation phenomena. First, lowering the feed voltages of the five-pole anode outputs. So that the amplifier can work in more linear areas. As a result, the output resistance is reduced as well as the rate of harmonic deformation decreases. Secondly, apply feedback with all the good she brings with her. Also, to achieve greater power output, output lamps can function as pendants as they are built.
In general, improvements to devices can be made on the basis of each manufacturer's requirements from the device.
These can be based on size, performance, sound quality, or appearance, cost and much more.
Related Circuits
This circuit is designed for use with inductive pick-up elements and dynamic microphones. Most soundcards feature a line input and a separate input for electret (condenser) microphones. To connect an inductive tape recorder head or a dynamic microphone, an...
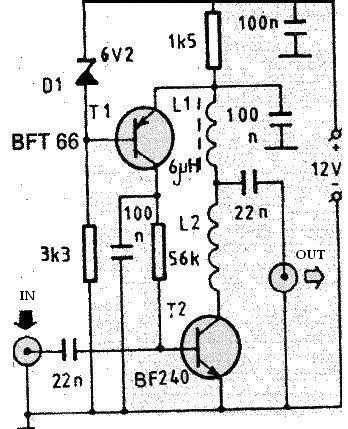
The PCB of this circuit should be positioned close to the antenna within a compact metallic enclosure. This VHF antenna circuit requires a 12 volts DC power supply, which can be sourced from a 12-volt battery, as the current...
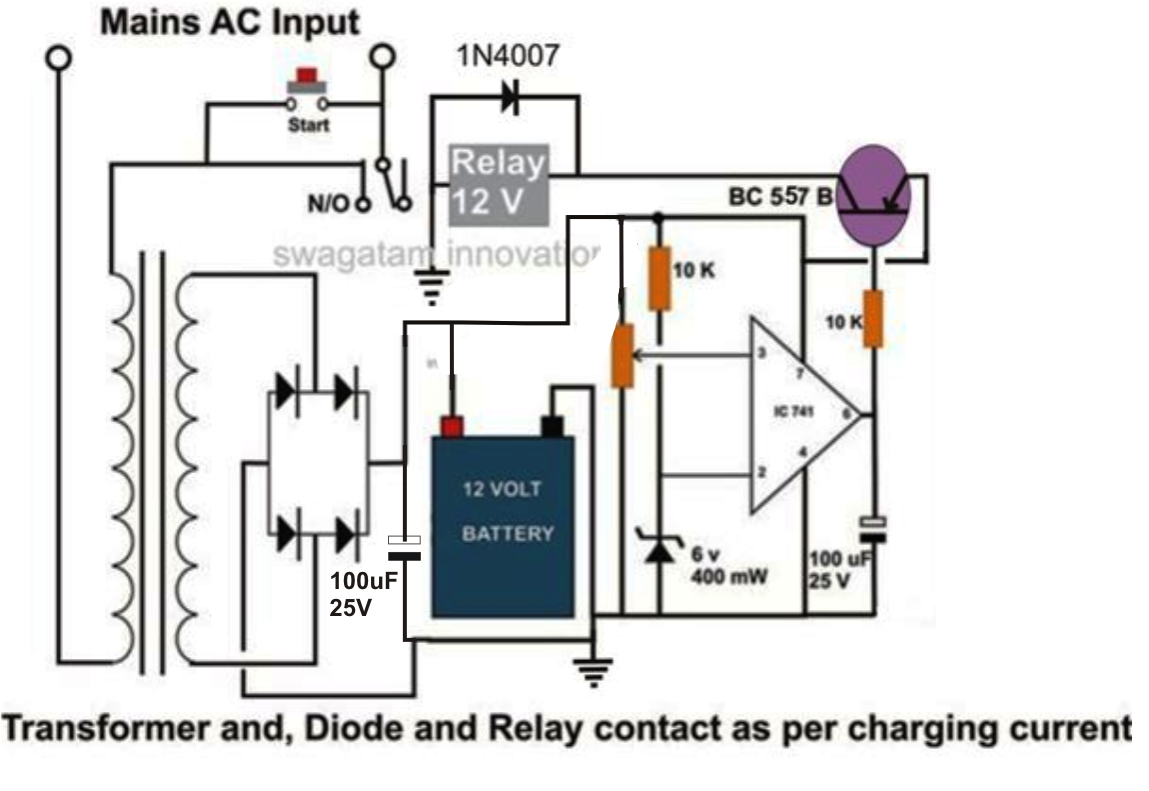
This design is intended for charging high-capacity lead-acid batteries in the range of 100 to 200 Ah. The system operates automatically, disconnecting power from both the battery and itself once the battery is fully charged. For simplicity, a filter...
As is commonly the case, this supply was born of necessity. There is absolutely nothing special about the circuit, except that as shown, it is quite capable of up to 20 Amps intermittently or 10A continuous. Simply use a...
Variable-gain amplifiers (VGAs) can be used in many types of systems, such as radio receivers. In this system, the input signal voltage depends on an. Variable-gain amplifiers (VGAs) are integral components in various electronic systems, particularly in radio receivers where...
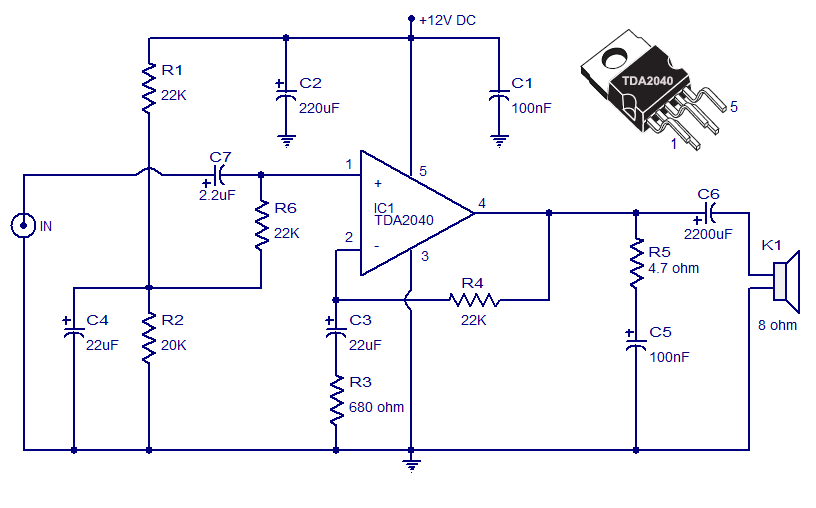
The Car Stereo Amplifier Circuit featuring the TDA2040 is presented here. The TDA2040 is a monolithic integrated audio amplifier that operates in Class AB mode. This integrated circuit includes built-in short circuit protection and thermal management features, allowing it...