
SWR Meter

t1 ~ 1 / (Uv - Ur) = A t2 ~ 1 / |Ur| = B T = t1 + t2 ~ 1 / (Uv - Ur) + 1 / |Ur| = A + B
The relative current I_rel [%] through the indicator is:
I_rel = t1 / T ~ A / (A+B)=1 / (1 + B/A) = 1 / [1 + (Uv - Ur) / Ur ] = Ur / Uv
I_rel [%] = 100% x Ur / Uv VT1 short-circuits Uv to the +3 V virtual ground potential and therefore only -Ur is active. The negative voltage, -Ur, begins the t2 charge period until the OP amp output voltage exceeds the 2/3 comparator threshold and the outputs 7 and 3 go "low". VT1 is switched off again and the process repeats indefinitely. "High" at pin 3 means no current flow and "low" means 100 uA current flow through current limiter R9 and the indicator. All necessary calculations are made by a small analogue electronic circuit (divider). This circuit isn't new, it was used at a time before microprocessors or cheap logarithmic ICs were available. To align, set the Uv terminal to +2 V and the Ur terminal to -1 V. The voltage rates are referring to the + 3 V virtual ground. To get the fixed voltages, use two potentiometers and feed each with +6 V against real ground (0V). Connect one slider to the Uv terminal and the other one to the -Ur terminal. Against the real 0 V ground the slider voltages should be +5 V and +2 V. The related SWR calculation looks like this:
SWR = (Uv + Ur) / (Uv - Ur) = (2V + 1V) / (2V - 1V) = 3 / 1 = 3.
Because (Uv - Ur) and |-Ur| are equal, the pulse to break ratio will be equal too (symmetrical rectangle signal at IC2 pin 7). The indicator pointer should stay in the 50% position. This corresponds to the before manually calculated SWR of 3. A deviation from the center position may require a balancing resistor in series or in parallel to R9. Now remove both potentiometers and adjust the reflectometer by C1 to very little or no |-Ur|. The assignment between SWR and the relative current is done graphically when calibrating the indicator scale. At Ur = 0 V no current flows through the indicator and the pointer remains at 0% and shows a SWR of 1. Ur = 0.5 x Uv makes a current flow over 50% of the period time T. The pointer stays at the center position corresponding to SWR = 3. At Ur = Uv the 100% end position (SWR = infinity) is reached.
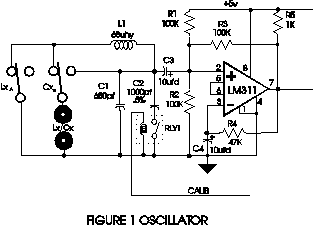
The SWR meter circuit utilizes an NE555 timer IC configured as a window comparator to facilitate the measurement of reflected power (Ur) against forward power (Uv). This configuration allows for real-time SWR readings without the need for repetitive calibration, which is essential when adjustments are made to the transmitter settings or antenna configurations. The operation of the circuit hinges on the timing characteristics of capacitor C6, which undergoes charging and discharging cycles controlled by the NE555 outputs.
The charging time (t2) is determined by the reflected power, while the discharging time (t1) is influenced by the forward power. The relationship between these time intervals is critical, as it enables the calculation of the relative current (I_rel) flowing through the indicator. The circuit's design ensures that the output signals from the NE555 reflect the instantaneous conditions of the RF power being measured.
For calibration, the circuit requires specific voltage settings at the Uv and Ur terminals, achieved through the use of potentiometers. This allows for precise adjustments to be made, ensuring the SWR meter provides accurate readings across a range of operating conditions. The calculated SWR value is derived from the relationship between the forward and reflected power, allowing users to assess the performance of their antenna system effectively.
The integration of the NE555 timer as a window comparator in this application exemplifies a classic analog approach to RF power measurement, providing a reliable solution that predates the widespread adoption of digital processing technologies in electronic measurement systems.A simple SWR meter first needs a calibration to Uv = 100 % (forward power). When switching over to Ur (reflected power) the SWR is indicated. This procedure has to be repeated every time a change is made to the transmit power, antenna tuner or frequency etc. With the help of the following circuit one can read the SWR directly without repeating the calibration after every change.
The timer IC NE555 is used as a window comparator in this application. It controls the charging and discharging of capacitor C6. The discharge period, t1, begins when VT1 is switched off. Both NE555 outputs 7 and 3 go "high" when the OP amp output voltage falls below the 1/3 threshold of the comparator. It works according to the principal that the ratio of capacitor charging time t2 to discharging time t1 is inversely proportional to the ratio |-Ur| / (Uv - Ur). t2/t1 = (Uv-Ur) / |-Ur|). The relationship between time and voltage is as follows: t1 ~ 1 / (Uv - Ur) = A t2 ~ 1 / |Ur| = B T = t1 + t2 ~ 1 / (Uv - Ur) + 1 / |Ur| = A + B The relative current I_rel [%] through the indicator is: I_rel = t1 / T ~ A / (A+B)=1 / (1 + B/A) = 1 / [1 + (Uv - Ur) / Ur ] = Ur / Uv I_rel [%] = 100% x Ur / Uv VT1 short-circuits Uv to the +3 V virtual ground potential and therefore only -Ur is active.
The negative voltage, -Ur, begins the t2 charge period until the OP amp output voltage exceeds the 2/3 comparator threshold and the outputs 7 and 3 go "low". VT1 is switched off again and the process repeats indefinitely. "High" at pin 3 means no current flow and "low" means 100 uA current flow through current limiter R9 and the indicator.
All necessary calculations are made by a small analogue electronic circuit (divider). This circuit isn't new, it was used at a time before microprocessors or cheap logarithmic ICs were available. To align, set the Uv terminal to +2 V and the Ur terminal to -1 V. The voltage rates are referring to the + 3 V virtual ground. To get the fixed voltages, use two potentiometers and feed each with +6 V against real ground ( 0V). Connect one slider to the Uv terminal and the other one to the -Ur terminal. Against the real 0 V ground the slider voltages should be +5 V and +2 V. The related SWR calculation looks like this: SWR = (Uv + Ur) / (Uv - Ur) = (2V + 1V) / (2V - 1V) = 3 / 1 = 3.
Because (Uv - Ur) and |-Ur| are equal, the pulse to break ratio will be equal too (symmetrical rectangle signal at IC2 pin 7). The indicator pointer should stay in the 50% position. This corresponds to the before manually calculated SWR of 3. A deviation from the center position may require a balancing resistor in series or in parallel to R9.
Now remove both potentiometers and adjust the reflectometer by C1 to very little or no |-Ur|. The assignment between SWR and the relative current is done graphically when calibrating the indicator scale. At Ur = 0 V no current flows through the indicator and the pointer remains at 0% and shows a SWR of 1.
Ur = 0.5 x Uv makes a current flow over 50% of the period time T. The pointer stays at the center position corresponding to SWR = 3. At Ur = Uv the 100% end position (SWR = infinity) is reached. 🔗 External reference
Related Circuits
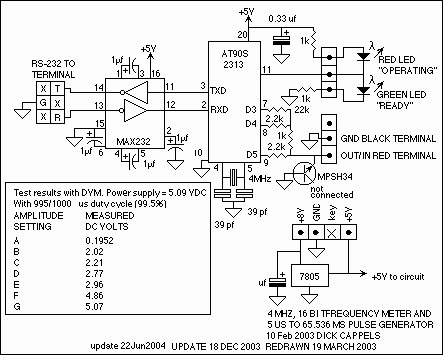
Power input is to a 7805 5 volt regulator. A pair of LEDs is connected between the 5 volt supply and ground, with current limiting resistors in series and one pin on the AT90S2313 shunts the current through one...
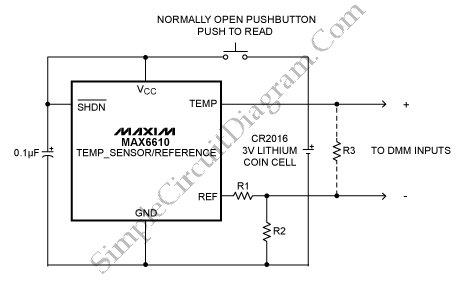
This is a simple temperature measurement probe circuit. This circuit measures temperature either on a PC board or at the probe tip. The temperature measurement probe circuit is designed to accurately monitor temperature variations in various environments, including printed circuit...
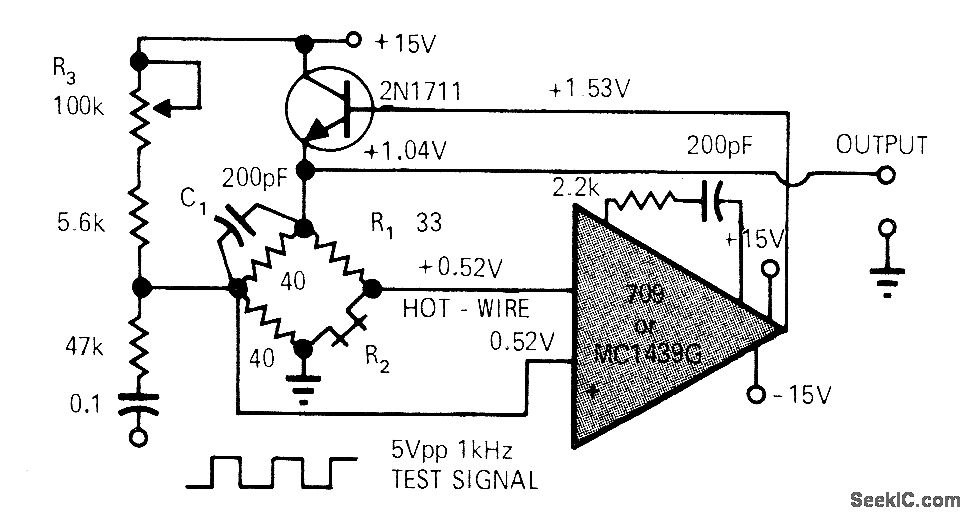
A simple operational amplifier (op-amp) circuit combined with a transistor creates a reliable hot-wire anemometer for measuring the flow of gases or liquids. Resistor R2 is heated above ambient temperature within a Wheatstone bridge configuration that includes an overheat...
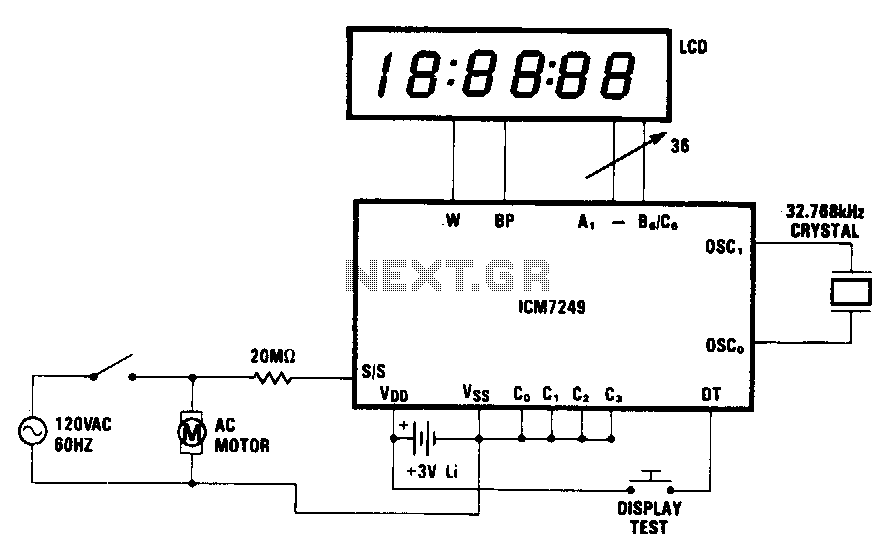
In this application, the ICM7249 is configured as an hours-in-use meter that displays the total number of whole hours of line voltage applied. The 20-MD resistor and high-pass filtering enable AC line activation of the SIS input. This configuration,...
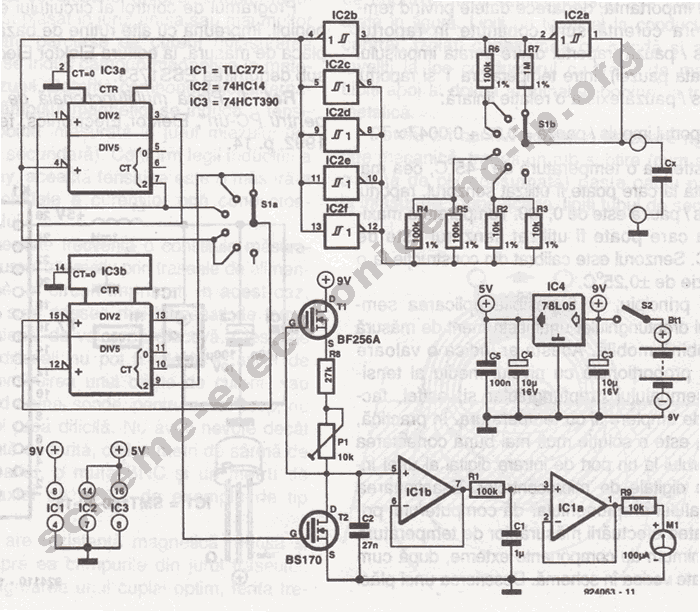
The circuit consists of an oscillator with variable frequency, a frequency divider, and a measurement stage. The oscillator is based on an inverter from a 74HC14 and generates a frequency that is inversely proportional to the capacitance of the...
An electronic project to construct an LC meter project kit of exceptional accuracy to measure both inductance and capacitance—an inductance meter and capacitance meter all in one unit. It is readily available as a comparatively inexpensive kit, which is...