
To improve reports use diagrams wisely
To create effective electronic schematics, it is vital to adhere to best practices in diagram creation and presentation. The use of schematic-capture software not only enhances clarity but also allows for the incorporation of standardized symbols and notations that are universally recognized in the engineering community. This practice ensures that the schematic is not only visually appealing but also functional and informative.
When constructing a schematic, it is essential to define all components clearly and to use a consistent labeling system. Each component should be uniquely identified, and any abbreviations used must be defined in the accompanying documentation. This practice reduces the likelihood of misinterpretation and ensures that the schematic can be understood by individuals who may not be familiar with the specific project or its nuances.
Moreover, the layout of the schematic should follow a logical flow that reflects the operation of the circuit. Components should be arranged in a manner that guides the viewer through the circuit's operation, from input to output. This approach not only aids in comprehension but also facilitates troubleshooting and maintenance.
In addition to clarity, attention must be given to the scale and proportions of the schematic. Components should be drawn to scale where possible, and the spacing between elements should be sufficient to prevent overcrowding. This practice enhances readability and allows for easier identification of connections and pathways within the circuit.
Finally, when presenting schematics in reports or publications, it is important to consider the medium of presentation. High-resolution images should be used to ensure that details remain sharp and clear, even when printed or viewed on various devices. If color is used in the schematic, it should be chosen with accessibility in mind, ensuring that the information is conveyed effectively to all viewers, regardless of their visual capabilities.
By following these guidelines, engineers can create schematic diagrams that are not only informative and accurate but also accessible and easy to understand, thereby enhancing communication and collaboration within the engineering field.This column offers tips about how to avoid common problems with charts, diagrams, and other graphic information. Engineers use diagrams routinely, but although the detailed schematic diagram on your lab bench accurately represents your work, in the same form it might have too much information for a monthly progress report or a conference paper.
1. Ensure you include all the necessary information in diagrams, charts, and equations. Nothing irks me more than an article or report that all of a sudden includes something new and without explanation. Recently I started through a series of math steps in an article and found the author introduced a new term halfway through.
No information in the text described where that term came from or what it represented. Don`t skimp on the details, and don`t make jarring jumps in stepwise information. 2. Don`t include unused information. When I edited electronics articles I often found authors would simply cut a diagram out of a data sheet or application note. Those diagrams included too much information, such as the name of every functional block, or sections not mentioned in the article text.
Undefined acronyms and abbreviations can cause confusion. Readers wonder if related information has gone missing or if they should already know what those labels in a diagram mean. If information in a diagram doesn`t support your writing, leave it out. Schematic diagrams in documents and reports often suffer from information overload. When you write a report, an application note, or create a presentation, unneeded component information can confuse your audience.
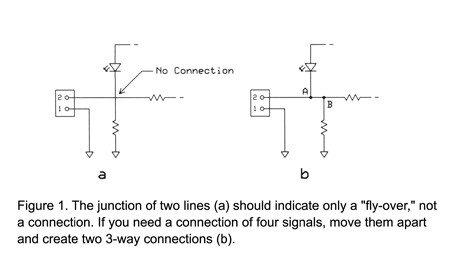
Label only the components referred to or used to illustrate a concept. Avoid ambiguities in schematic diagrams. First, use a schematic-capture program to draw good circuit diagrams. Neatness counts. If you don`t already have schematic-capture software, you can find inexpensive, free, and demonstration programs that work well. Demo programs usually have a diagram-size or number-of-elements limit. Second, recheck your diagram for errors. Third, make only three connections at one point. If someone redraws your circuit diagram, it becomes obvious a connection exists when three signals meet, as shown in Figure 1.
Suppose you use a four-signal connection. When redrawn for publication, or due to poor image resolution, people might wonder whether they see a four-way connection or a fly-over of two separate signals. When you plot data, label each axis with a unit (Volts) and the abbreviation (V). Many diagrams on the Internet fail to label axes, so readers wonder what the graph shows. Graphs also make it easy to distort data, either inadvertently or on purpose. Figure 2 shows a bar chart that represents sales of $4M, $8M, and $90M for three years. A graph that starts at $0 shows the real trend. But if the chart starts at $3M without carefully noting a break between $0 and $3M, the jump from $4M to $8M appears out of proportion to the actual increase.
6. Do not add a third dimension to graphical data. A shadow or depth in a bar chart, for example, might look nice, but the dimension of depth adds nothing useful to the data. 7. If possible, use a professional photographer to take pictures of components, apparatus, or products. When you must take your own photos, use an appropriate camera setting for a depth of field compatible with your product`s dimensions.
You want everything in focus. Use a polarizing filter to minimize reflections. Learn about photographic lighting techniques and equipment. 8. Not everyone sees color perfectly, so use colors almost everyone can differentiate. On charts and plots, for example, use symbols along with color to indicate data points. Instead of using, say, a green arrow to point to something, use a black arrow and label it 1, A, or something else and refer to it by its label, not its color. Avoid placing red and blue areas next to each other. Our eyes have a chrom 🔗 External reference
Related Circuits

A 2004 Chevrolet Impala is experiencing issues with the rear defogger. The owner is unable to locate the fuse for the rear defogger, although the relay has been found. Both the manual and the vehicle's diagram indicate a 30-amp...
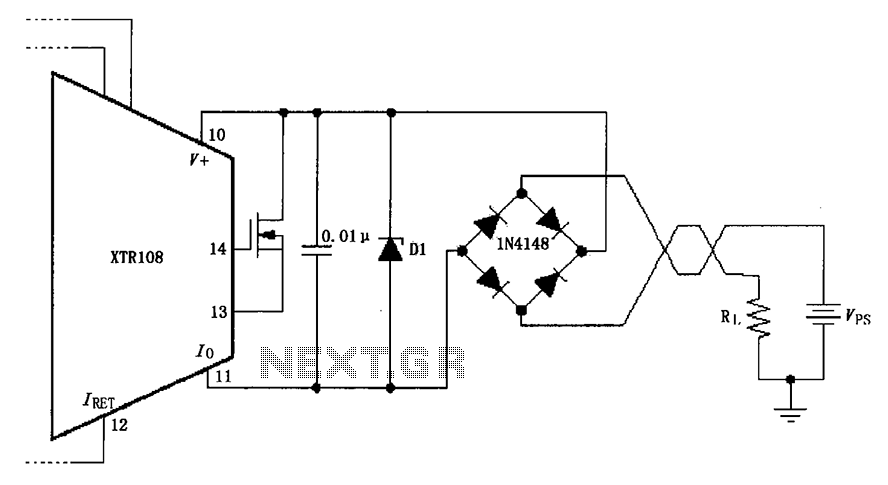
The circuit utilizes a Zener diode (D1) for overvoltage protection and a diode rectifier bridge for reverse voltage protection. The 1.4V drop across the diodes will result in a maximum voltage loss, meaning that the supply voltage (VPS) must...
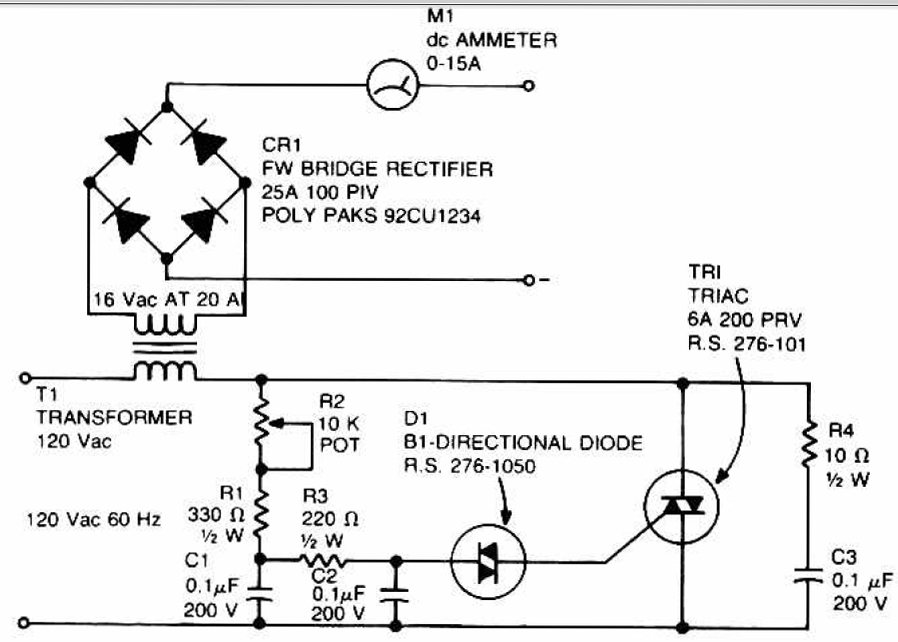
This circuit can be used to charge accumulator and cell batteries. It features a very stable output that extends the battery life and maximizes the added battery capacity. The charging process is also quite fast, optimizing the time required...

This simple LED torch is powered by a 2-transistor blocking oscillator that increases the voltage from a 1.5V cell. The design utilizes the natural current limiting characteristics of a 150 µH choke to prevent the white LED from being...
This is the unedited version of the article "Improved Anode-Circuit Parasitic-Suppression For Modern Amplifier-Tubes," which was published on page 36 of the October 1988 issue of QST. A subsequent discussion on this topic appeared in the September and October...

The circuit is powered by a 15-V wall adapter (not shown). It utilizes the characteristic of the phone line voltage, which drops from 48 V to 10 V when an extension is taken off the hook. This voltage drop...