
TTL pulse recording for fMRI data collection
The ezlog data logging software is a specialized tool designed for use in neuroscience research, particularly in studies involving functional MRI (fMRI). The software's primary function is to synchronize the timing of various sensory stimuli with brain imaging data, allowing researchers to analyze how different stimuli affect brain activity. The ability to log precise timing information is crucial for understanding the temporal dynamics of brain responses to stimuli.
The hardware setup involves creating a custom cable that connects a stimulus presentation computer with a scanner and a data logging computer. This setup requires careful attention to the electrical characteristics of the signals being transmitted. The TTL pulse is a standard method for digital signaling, which allows for reliable communication between devices. The detailed instructions for constructing the cable emphasize the importance of ensuring that all devices share a common ground to avoid signal integrity issues.
The use of photocouplers, such as the PC815, is a critical aspect of the circuit design, as they provide electrical isolation between the scanner and the logging computer. This isolation is essential to protect sensitive equipment from potential damage due to electrical surges or incorrect voltage levels. The circuits designed for both electrical and optical signals cater to different scanner models, ensuring compatibility across a range of equipment.
In summary, the ezlog data logging software and its associated hardware setup offer a robust solution for synchronizing sensory stimuli with brain imaging data. The detailed instructions provided for constructing the necessary cables and circuits ensure that researchers can implement the system effectively while minimizing the risk of damage to their equipment. This comprehensive approach facilitates accurate data collection and enhances the reliability of findings in neuroscience research.This web page describes how to install and use my ezlog data logging software. This software allows you to measure when different events happened, allowing you to synchronise the timing of different stimuli. Specifically, my software is designed to get a detailed report of when visual/auditory or tactile stimulation occurred relative to brain imag
es. By collecting functional MRI scans that are sensitive to changes in blood flow, we can identify the brain regions that are involved with certain tasks. My software will measure the time when each brain image was acquired as well as logging the time of the stimulus that the participant perceived.
This tutorial is broken into four secions: Hardware: you need to create a cable that connects your scanner and stimulus presentation computer to a computer that will log the times of stimuli and scans. You need to create a cable that can connect the different devices that you wish to record. Each device should be able to generate a TTL (transistor-transistor logic) pulse. The diagram on the right illustrates a cable designed to connect the parallel ports of two computers together, as well as connecting to a scanner.
This picture shows a coaxial connector plugging into the scanner, matching the TTL output found on Philips Intera scanners with system release 10 or later. Note that the stimulus presentation computer sends outputs through pins 2. 5, and these are recorded on the input pins of the data logging computer. In addition, note that the 0volt ground lines (shown in black) connect all devices (on a computer`s parallel port, pins 18.
25 are all ground lines). Make sure your scanner is set up to generate pulses with your EPI sequences. For Philips scanners, you go to the `Dyn` (Dynamic) page of the sequence protocol and set the `Dyn. Sync. Pulse` to TRUE. Note that this may increase the acquisition time of your volumes (e. g. we recorded the duration of each volume increased by 15ms). The pulses generated by your scanner should have a duration longer than 1ms. My software only checks the parallel port every millisecond, so it will typically miss very brief pulses. For example, by default the Philips Intera generates a 0. 05ms pulse. Furthermore, the input to the parallel port needs to be an electrical TTL pulse (not the optical pulse generated by modern Siemens scanners).
Therefore, you may need to build extra hardware to connect your scanner to a PC (regardless of whether the PC is running my software or something else such as EPrime ). Below are two very inexpensive circuits I have built myself (they were designed by my dad, Bob Rorden, Phil Moore suggested using the inexpensive IF-D95T).
These can be powered by a battery or a small power supply. I am not responsible for any damage that may result from other people`s implementation of these circuits. However, note that if correctly constructed both designs allow the scanner to be electrically isolated from your hardware.
This should ensure that your scanner can never be damaged by your PC. Specifically, both circuits make sure that the signal between the scanner and the PC is an optical pulse, not a direct electrical signal. For example, if the scanner generates an electrical signal, I use a PC815 photocoupler to isolate the two systems.
For these circuits, you should connect the `OUT` pin the data logging computer`s pin 11 and the circuit ground to the data logging computer`s pin 19 (as described in the previous section). With all Philips scanners and Siemen`s EPI scanner sequences prior to 2002B you will want to use the circuit for an electrical signal.
For recent Siemens systems, you should use the circuit for the optical signal. The Siemens manaul `Triggersignal outputs programmed by sequences` includes more details, as well as an alternative circuit for converting an optical pulse to a TTL pulse (my circuit is less expensive and also lengthens the duration of the opti 🔗 External reference
Related Circuits
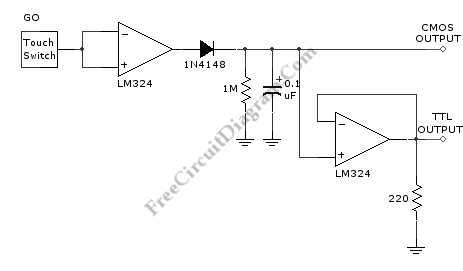
This is an interface circuit for digital data input. The circuit consists of a touch button, an operational amplifier (op-amp), a diode, a capacitor, and resistors. Any conductive surface can be used. The interface circuit designed for digital data input...
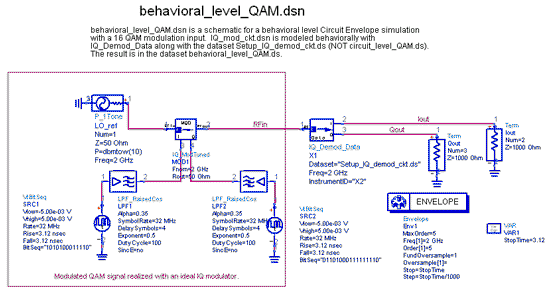
The IQ_Demod project demonstrates the application of the IQ_Demod_Setup and IQ_Demod_Data components within the ADS environment. These components are included in the ADS behavioral model suite, located under the System - Data Models palette. The file "IQ_demod_ckt.dsn" represents the...
The following demonstrates a power-saving circuit that pulses a sensor for 1 second every 30 minutes. It is designed to monitor the levels of salt. The sensor shown is an optocoupler with an infrared-emitting diode, intended to monitor the...
The circuit below demonstrates the generation of a single positive pulse that is delayed in relation to the trigger input time. It is similar to a previously described circuit but utilizes two stages, allowing for control over both the...
This circuit diagram represents a logic probe based on a single CMOS integrated circuit (IC). The logic probe indicates three conditions: High, Low, and Pulsing. Additionally, no LEDs will illuminate when the probe input is in a high-impedance state,...

The CA3140 is a 4.5 MHz BiMOS operational amplifier featuring MOSFET inputs and a bipolar output. This operational amplifier integrates the benefits of PMOS transistors and high voltage performance. The CA3140 operational amplifier is designed to provide high-speed performance while...