
audio How to make LED bar graphs to measure intensity

To create an LED bar graph that visually represents audio intensity, a circuit can be designed utilizing a series of individual LEDs arranged in a linear format. The primary objective is to have these LEDs illuminate in response to varying audio signals, particularly emphasizing bass frequencies.
The circuit design can incorporate an audio signal input, which is processed through a rectifier to convert the AC audio signal into a DC voltage that reflects the intensity of the sound. A low-pass filter may be utilized to isolate the bass frequencies, ensuring that the LED response is primarily driven by low-frequency signals.
Following the filtering stage, the resulting DC voltage can be fed into a microcontroller or a dedicated LED driver IC. If a microcontroller is employed, it can be programmed to map the voltage levels to specific LED outputs, allowing for a visual representation of the audio intensity on the bar graph. Each LED can be controlled independently, illuminating based on the amplitude of the incoming audio signal.
For a more straightforward solution, an analog LED driver IC, such as the LM3914 or LM3915, can be used. These ICs are designed to drive multiple LEDs in a bar graph or dot mode, responding directly to an analog voltage. The configuration of the IC can be adjusted to set the range of voltage that corresponds to the number of LEDs illuminated, thus creating a dynamic visual display that corresponds to the audio input.
The power supply for the circuit must be adequately considered to ensure that it can provide sufficient current for all LEDs when lit. Additionally, current-limiting resistors should be included in series with each LED to prevent damage from excessive current.
Overall, this circuit design allows for an engaging visual representation of audio intensity through LED bar graphs, enhancing the auditory experience with a corresponding visual display.Make those LEDs into LED bar graphs that will show the intensity. For example, I want a song with a loud base to make the bar graph shoot up to the top. The bars of the LED bar graph I would like to just be individual LEDs. I was getting the effect with an arduino but I was hoping there was easier way to do this. 🔗 External reference
Related Circuits
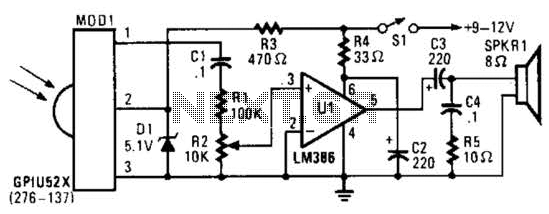
This circuit utilizes an infrared pulse-to-audio converter to assist in troubleshooting infrared remote controls, making it an effective tool for detecting infrared light sources. It employs a photo cell module (Radio Shack P/N 276-137) to detect IR radiation and...
Designs for audio amplifiers with DC coupling to the load are not frequently seen today, despite offering distinct advantages. Audio amplifiers that employ DC coupling to the load provide several benefits that can enhance performance in specific applications. In traditional...
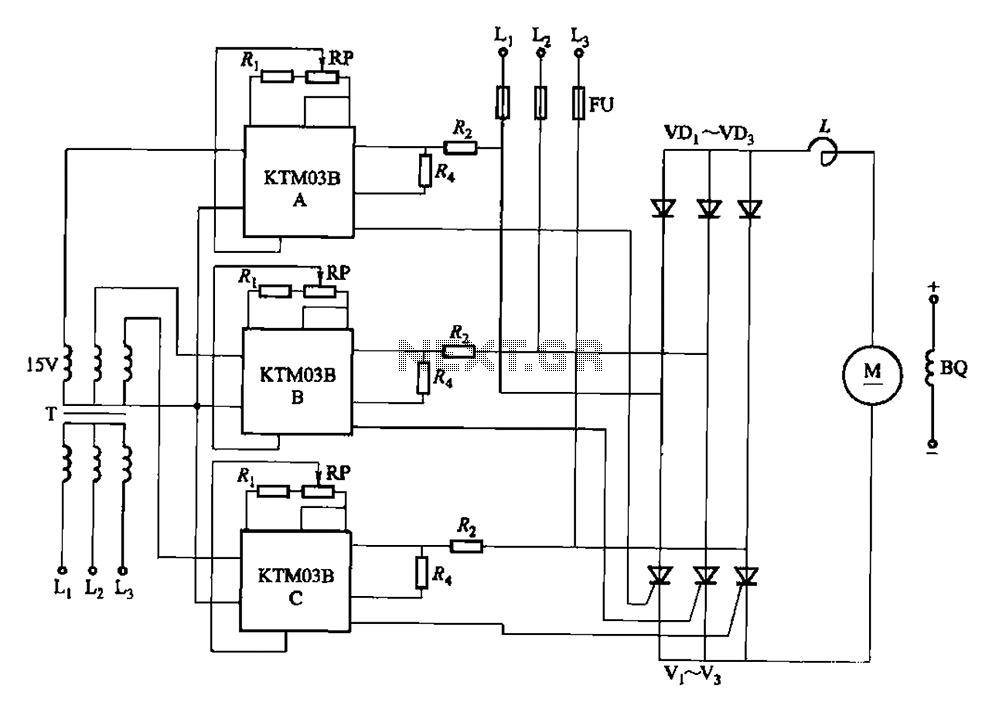
Adjusting the phase potentiometer RP can change the conduction angle of each corresponding thyristor (V1-V). This adjustment alters the voltage applied across the load. The circuit utilizes a phase control technique to manage the power delivered to a load by...
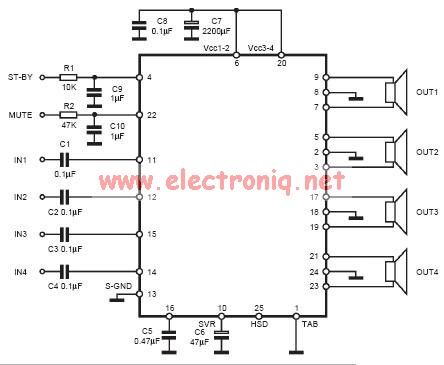
The input capacitor is used for low-frequency cut-off, with a standard value of 0.1 µF, resulting in a cut-off frequency of approximately 16 Hz. The input capacitor plays a crucial role in filtering unwanted low-frequency signals in electronic circuits. By...
This month's project is based on the 4017 chip that was used in a previous project. It is advisable to review the fundamentals of the 4017 chip as presented in last month's project. The circuit has been modified slightly;...
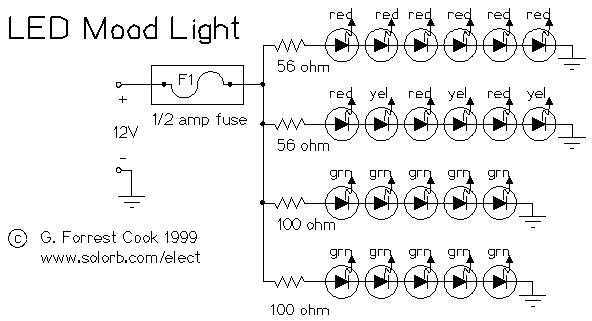
This circuit makes a nice lamp that consumes little power, runs cool, and has an incredibly long lifetime. The lamp puts out a warm yellow shade of light; the color may be adjusted by changing the number of red...