
Electronic dice with 7 LED

A 390 ohm resistor (R5) keeps -HOLD pin at low-level when P1 is released: so the numbers do not change and the LEDs display steadily the last number drawn. When pressing P1, the -HOLD input goes to +5V because of the button's action - overriding R5 effect. Nutchip timer is no longer blocked and it keeps changing state at a fast rate, giving a random rolling effect as long as P1 is pressed. More: At first glance, the way the LEDs are drawn can look messy. Don't be fooled by appearances - the schematic is drawn to simplify breadboarding, and the way the parts are placed reflects the actual solderless breadboard prototype. Follow carefully every connection to discover that we have just three LEDs pair connected to outputs OUT2, OUT3, OUT4 and a looney LED connected to output OUT1. This circuit is suitable for breadboard assembling. The photo shows how to place the parts on a solderless breadboard. The process requires careful LED placement, in order not to reverse or exchange them. All of the LEDs have their cathode pin towards Nutchip, except the mid one (#7) whose cathode is faced up. Common LEDs have their case flattened in proximity of cathode pin. Also, LEDs have the pins divaricated enough to allow an extra breadboard hole between them. E.g., LED #2 anode goes to red wire, and cathode to yellow. The green wire is routed through. We suggest you to temporarily modify the truth table increasing timeouts to 2 or 3 seconds (in place of actual 30 mS) in order to perform a circuit test - and to understand fully how the circuits works and reacts to user action!
Chip programming is easy: if you have an interface like ours, plug it into breadboards holes, they are highlighted with a red border and a "PC" label in the photo. Right after table programming, the circuit is ready to work. Press P1: as long as you keep it down, the numbers must run on the LED display. As soon as you release P1, display must freeze on the last number shown. After this test is completed OK, reload the table with timeouts set to 30 mS, and you're finished. With the truth table above, all dice sides have the same likelihood of being drawn. This fact is a direct consequence of all the timeouts being the same. But what if we make timeouts different from each other, e.g. doubling it for some faces and halving it for some other? The net result will be a greater probability for the numbers with longer timeouts, a trick very hard to discover. An interesting experiment is to make statistics playing a large number of times - let's say 100 - at first with the unmodified truth table, then to repeat the same experiment with the altered truth table. How many times did you get 1? And 2, 3? This is an impressive work to show the class: try drawing a graph of how numbers sum up using a spreadsheet program like Microsoft Excel, and you will clearly see how timeouts affect results. To make breadboarding easier, resistors and LEDs are placed in the same positions as in the schematic draft. Compare your breadboard against our example, and see also the wire color table below. A critical path is outlined in the yellow frame: the orange wire should not touch the 390-ohm resistor, in case insulate resistor pin with plastic tubing. Every LED has a current-limiting resistor (R1, R2, R3, R4). The LED pair's resistor is lower (220 in place of 390 ohm) to compensate for the voltage drop introduced by each LED. With the values given, the resulting current is about the same for single LEDs and pairs, in order to get uniform brightness.
The circuit utilizes a Nutchip microcontroller, which interfaces with various LEDs to create a visual representation of a random number generator, simulating a dice roll. The -HOLD input, connected to a push-button switch (P1), plays a crucial role in controlling the state of the LEDs by enabling or disabling the timer function of the Nutchip. When the button is not pressed, the -HOLD input remains low due to the 390-ohm resistor (R5), effectively freezing the current state of the LEDs. Upon pressing P1, the -HOLD input transitions to a high state (+5V), allowing the Nutchip to resume its operation, resulting in a dynamic display of changing numbers on the LEDs.
The circuit design emphasizes ease of assembly on a breadboard, with specific attention to the orientation of the LEDs to ensure correct functionality. Each LED is paired with a current-limiting resistor to maintain consistent brightness levels across the display. The schematic is crafted to facilitate straightforward connections and minimize potential errors during assembly.
To enhance functionality, the truth table governing the timing of LED changes can be modified for experimental purposes, allowing for different probabilities of number generation based on varying timeout durations. This feature adds a layer of complexity to the project, providing opportunities for statistical analysis and experimentation with the outcomes of the LED displays.
Overall, this project serves as a practical application of microcontroller programming and circuit design, illustrating fundamental principles of electronics while allowing for interactive user engagement through the push-button interface.This project takes advantage from -HOLD input, which is connected to push-button P1. As long as the -HOLD input is low, truth table's timeouts have no effect because this input serves to disable any state change provoked by timers. The effect is to freeze Nutchip's counting, stopping the LEDs on the number they were displaying at the time of key release.
Notably, we could have used -STOP input to get the same effect, although this does not apply as a general rule - there are occasions where these two pins behave differently. A 390 ohm resistor (R5) keeps -HOLD pin at low-level when P1 is released: so the numbers do not change and the LEDs display steadily the last number drawn.
When pressing P1, the -HOLD input goes to +5V because of the button's action - ovverriding R5 effect. Nutchip timer is no longer blocked and it keeps changing state at a fast rate, giving a random rolling effect as long as P1 is pressed.
At first glance, the way the LEDs are drawn can look messy. Don't be fooled by appearences - the schematic is drawn to simplify breadboarding, and the way the parts are placed reflects the actual solderless breadboard prototype. Follow carefully every connection to discover that we have just three LEDs pair connected to outputs OUT2, OUT3, OUT4 and a looney LED connected to output OUT1.
This circuit is suitable for breadboard assembling. The photo shows how to place the parts on a solderless breadboard. The process requires careful LED placement, in order not to reverse or exchange them. All of the LEDs have their cathode pin towards Nutchip, except the mid one (#7) whose cathode is faced up. Common LEDs have their case flattened in proximity of cathode pin. Also, LEDs have the pins divaricated enough to allow an extra bradboard hole between them. E.g., LED #2 anode goes to red wire, and cathode to yellow. The green wire is routed through.. We suggest you to temporarly modify the truth table increasing timeouts to 2 or 3 seconds (in place of actual 30 mS) in order to perform a circuit test - and to understand fully how the circuits works and reacts to user action!
Chip programming is easy: if you have an interface like ours, plug it into breadboards holes, they are highlighted with a red border and a "PC" label in the photo. Right after table programming, the circuit is ready to work. Press P1: as long as you keep it down, the numbers must run on the LED display. As soon as you release P1, display must freeze on the last numpber shown. After this test is completed OK, reload the table with timeouts set to 30 mS, and you're finished. With the truth table above, all dice sides have the same likelyhood of being drawn. This fact is a direct consequence of all the timeouts being the same. But what if we make timeouts different each other, e.g doubling it fo some faces and halfing it for some other?
The net result will be a greater probaility for the numbers with longer timeouts, a trick very hard to discover. An interesting experiment is to make statistics playing a large number of times - let's say 100 - at first with the unmodified truth table, then to repeat the same experiment with the altered truth table.
How many times did you get 1? And 2, 3? This is an impressive work to show the class: try drawing a graph of how numbers sum up using with a spreadsheet program like microsoft Excel, and you will clearly see how timeouts effect results. To make breadboarding easier, resistor and LEDs are placed in the same posiotions as in the schematic draft.
Compare your bradboard against our example, and see also the wire color table below. A criticalpath is outlined in the yellow frame: the orange-wire should not touch the 390-ohm resistor, in case insulate resistor pin with plastic tubing. Every LED has a current-limiting resistor (R1, R2, R3, R4). LED pair's resistor is lower (220 in place of 390 ohm) to compensate for the voltage drop introduced by each LED.
With the values given the resulting current is about the same for single LED and pairs, in order to get uniform brightness. 🔗 External reference
Related Circuits
Electronic potentiometer using a standard CMOS logic and analog multiplexers. Pot have low distortion (0.005% less at 1 V rms) and is it easy for beginners to understand. In the beginning, the art of Hi-Fi, in the absence of...
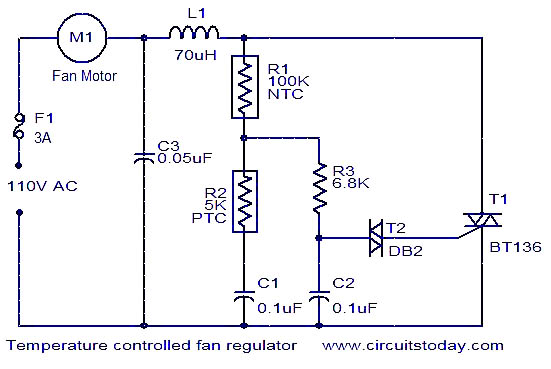
The function is designed to automatically control the speed of a fan based on the temperature. Components include a BT136 Triac, capacitor, resistor, relay, and fan motor. The circuit employs a temperature sensing mechanism to monitor ambient temperature levels. A...
This Project Digital Calendar using Microcontroller is an advanced digital calendar, which displays the Date, Day, Month over the LED display. It has an 8 bit Microcontroller which runs on the Program embedded on its ROM. Separate LEDs are...
A circuit was constructed based on an LED beating heart frame instructable, but it is not functioning as expected. There is also mention of a built LED sequencer. The LED beating heart circuit typically involves a microcontroller, such as an...
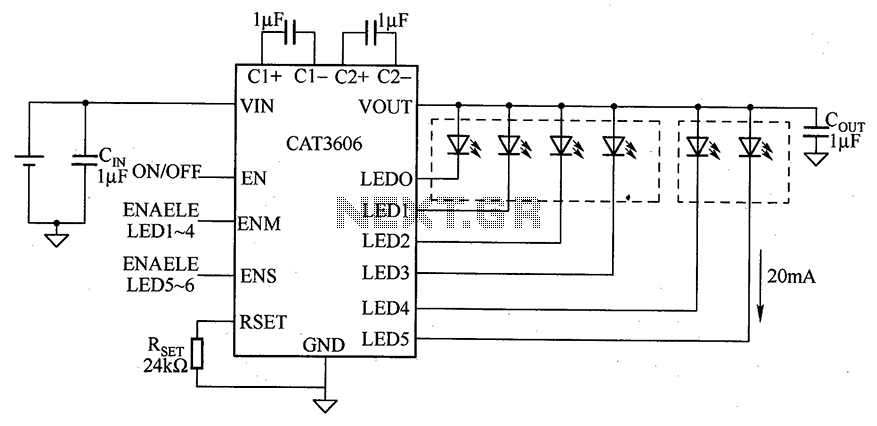
CAT3606 is a high-efficiency white LED driver. This adjustable charge pump is suitable for general-purpose, large-panel, flicker-free white LED backlighting and dual-display systems. The CAT3606 inductor boost circuit can replace conventional high-brightness backlighting requirements, thereby simplifying system design. It...
All LEDs require some form of current limiting. Connecting an LED directly to the power supply will burn it out almost instantly. Overdriving, even briefly, will significantly reduce its lifespan and light output. Fortunately, driving a single or a...