
HOW TO make a cheap narrowband A/F gauge

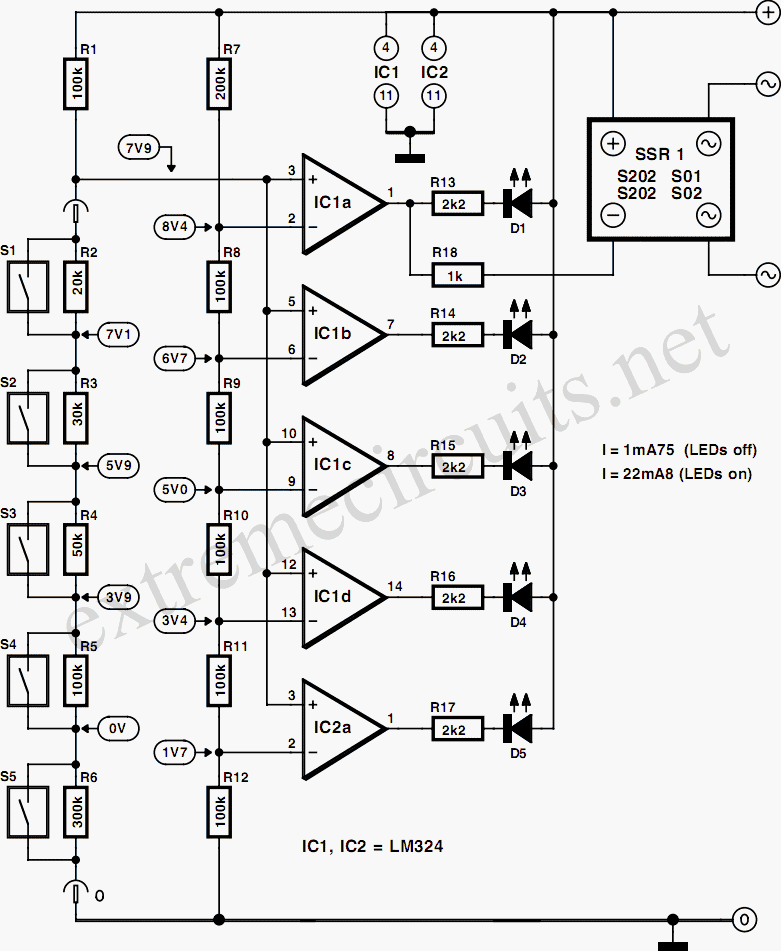
The design of this air-fuel gauge project involves several key components and considerations to ensure optimal performance and reliability. The oxygen sensor serves as the primary input device, providing real-time feedback on the air-fuel mixture by converting the exhaust gas composition into a corresponding voltage signal. This voltage signal is then processed by the driver chip, which translates the input into a visual representation on the LED bar graph.
The LED display is configured to reflect the air-fuel ratio, where each LED corresponds to a specific voltage range. The use of resistors R1 and R2 is crucial in defining both the resolution of the display and the brightness of the LEDs. By selecting appropriate resistor values, the sensitivity of the gauge can be tailored to suit specific engine configurations and performance requirements.
Incorporating potentiometers in place of fixed resistors allows for dynamic adjustments to the display characteristics, accommodating various tuning needs. This feature is particularly beneficial for performance engines that demand precise monitoring of the air-fuel mixture under different operating conditions.
The assembly process requires careful attention to detail, particularly during soldering operations. Using chip sockets can simplify the installation and replacement of components, reducing the risk of damage due to overheating. Proper orientation of the LEDs is essential to ensure correct functionality, as incorrect installation can lead to display failures.
For enhanced organization and ease of installation, utilizing ribbon cables for connections can streamline the wiring process, minimizing clutter and facilitating maintenance. This approach not only improves the aesthetic appeal of the installation but also enhances the overall durability of the connections.
In conclusion, this DIY air-fuel gauge project offers an accessible solution for monitoring engine performance, with the potential for customization to meet individual needs. By leveraging common electronic components and adhering to best practices in assembly and design, users can create an effective tool for optimizing engine tuning and performance.The way an engine management system monitors its Air / Fuel ratio is through the Oxygen Sensor (O2) stuck in the hot exhaust flow, usually before the catalytic converter. All O2 sensors are basically the same, with some being heated or others providing multiple signal lines.
An O2 sensor generates a voltage from 0-1Volt. A reading of 0 volts describes a LEAN condition, while a reading of 1 volt descrigbes a RICH condition. Autometer, Cyberdyne, Intellitronix, and many others manufacter A/F Gauges costing at least $30 or more. It is almost a certainty that all of those gauges uses the exact same driver chip to light up their display.
The only difference between the gauges will probably be the resolution of the display, which should be adjustable. This is for people who would like to create an inexpensive Air / Fuel meter. PLEASE read this entire procedure before taking this project on. No one but you is responsible if you burn yourself or screw up your car in anyway. Basic soldering skills are a necessity. If you decide to solder the driver chip directly, DO NOT leave the soldering iron on the chip to long as the heat will destroy the chip fairly quickly.
This DIY gauge can look pretty nice as you can carve out a little section in your cluster or dash and put the bargraph in there. but if you leave it dangling out, it doesn`t look pretty. Total cost: for this project is ~$10 bucks. ~$4 bucks if you manage to obtain some parts for free. No responsibility is taken if you break something while trying to execute this procedure. You should be familiar with engine tuning, engine management wiring, and electricity in general. A Bentley manual will also come in very handy. Chip sockets should probably be used as it is easier and there are fewer things that could go wrong. You don`t have to though. but make sure when you use the sockets that you don`t get the pins reversed when soldering. You can also un-solder the sockets out of old electronics or mother boards if you need some quickly. If you solder a bunch of wires from the chip to the LED socket you can have some placement flexibility for the LED display.
Be aware that LED`s only work one way. they have a Positive side and Negative side. There`s a flat spot in the corner of the bargraph `chip` to indicate Pin 1. There are many differant ways to make this a clean well executed project, but as always, the end result if from your own efforts. Such niceities as terminating the wires with connectors and what not. you can also use floppy drive ribbon cables to connect all the circuits together, which will make it easy and neat to mount the LED graph separately.
Most people want the wide band of the O2 measuring from 0-1v. But some might want a Finer Resolution. Where it`ll measure from 0. 4-1v. This would mean that the 1st LED will be ~0. 4v and the 10th LED will be 1v. Engines equipped with a turbo, blowers, or Nitrous, might want a finer resolution as the Air / Fuel ratio is especially critical for those motors. In a Naturally Asperated engine, the finer resolution might not be necessary as the proper mixture (14.
7:1) is at about 0. 5v from the O2 sensor. Resistor R1 is what determines the resolution for the LED display. Resistor R2 is what determines the relative brightness of the LED. You can stick potentiometers in place of these resistors in order to fine tune the bar graph resolution and display brightness. If you decide to use the Potentiometer (POT) you need to get a Ohm meter and measure the range at which resistance ranges from 2.
3k to 3. 3k. As it is adjustable, you can change it later. In order to r 🔗 External reference
Related Circuits
The light fader circuits described here share a common concept of creating a gradual "cool" switch ON and switch OFF effect for connected lamps. This means that each time the lights are activated, the result is a smooth transition...
In electronics, filter circuits are primarily used to restrict the passage of certain frequency ranges while allowing other frequency bands to proceed to subsequent stages of the circuit. A high-pass filter circuit permits only frequencies that exceed a specified...
The post discusses a simple delay ON circuit that enables a connected load to be powered on with a predetermined delay after the power switch is activated. This circuit is applicable for any scenario that requires an initial delay...
The operation principle of the proposed metal detector circuit is straightforward yet intriguing. The detection function is activated by sensing a decrease in the quality factor (Q) of the LC network associated with the circuit when a metal object...
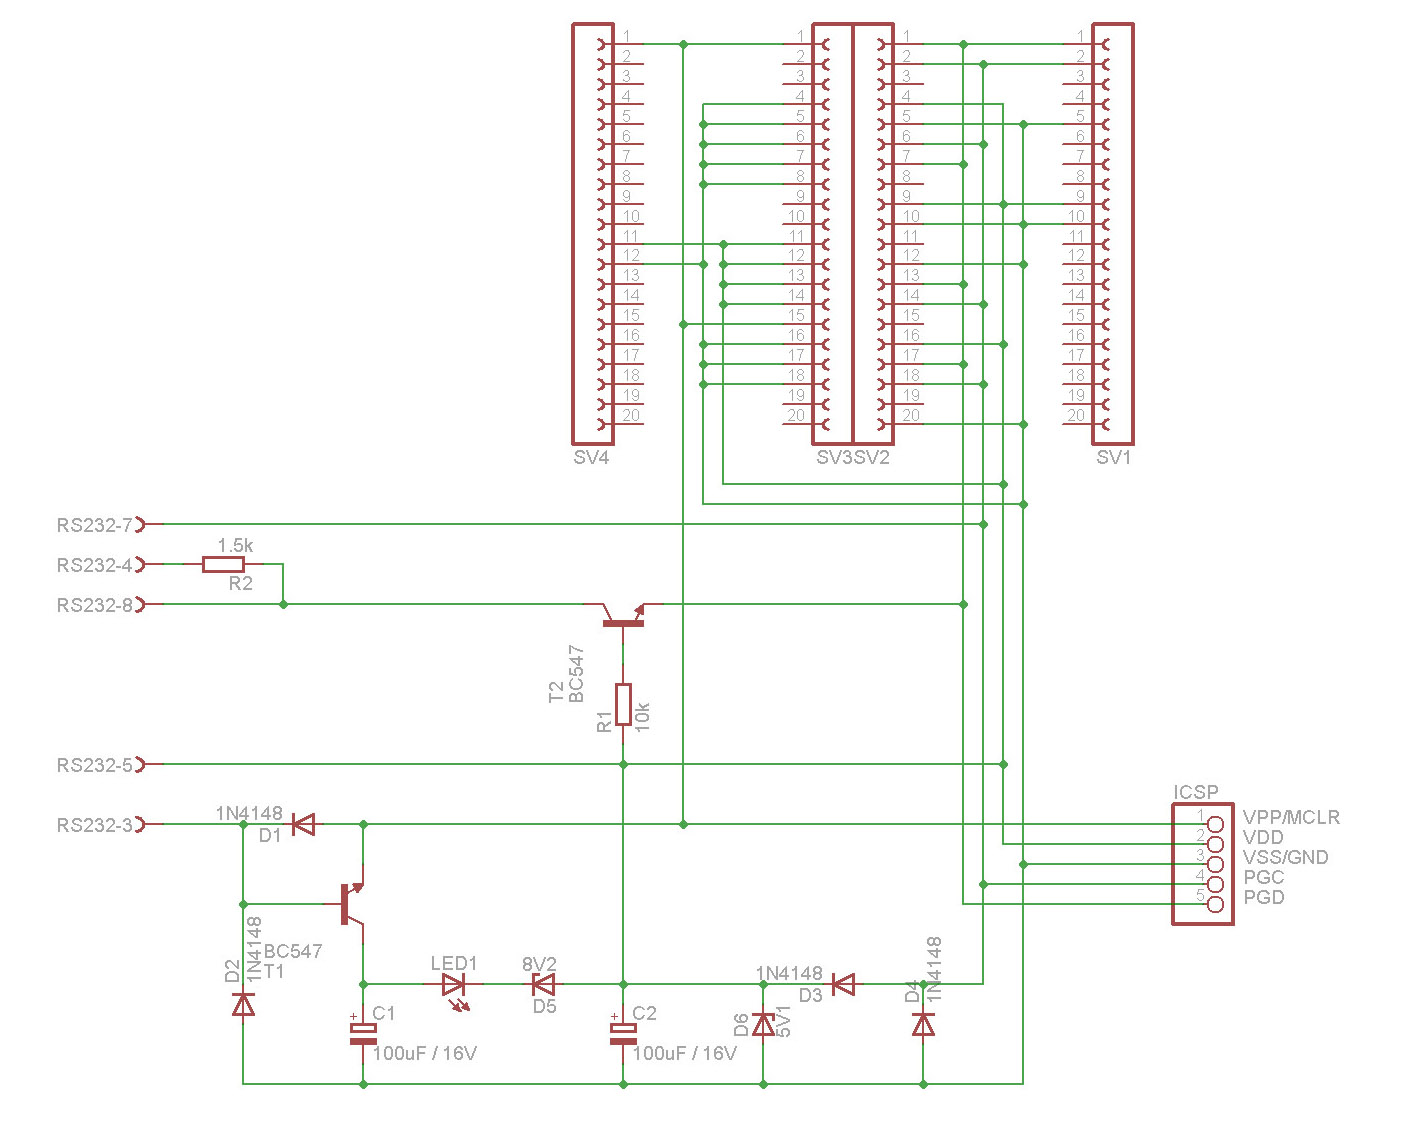
The JDM programmer operates with an RS232, 9-pin (DB9) serial connector on a computer and is utilized for loading source code (hex files) into microcontrollers. JDM programmers are cost-effective and relatively simple to construct. The specific JDM programmer being...
Collecting rainwater for garden use and grey water domestic applications is both ecologically and economically beneficial. Enthusiasts often utilize large underground tanks for storage. A challenge arises in determining the water level without manually opening the tank hatch. One...