
grid frequency
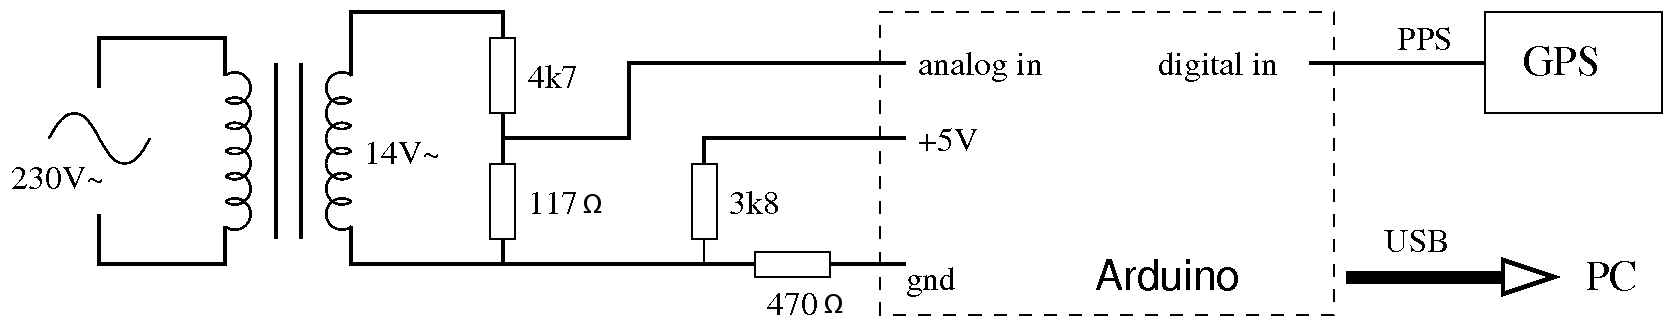
To create a practical electronic schematic based on the described setup, the following components and connections are necessary:
1. **AC Power Source**: A standard 230V AC wall socket serves as the primary power source.
2. **Transformer**: An isolation transformer from an old halogen lamp steps down the voltage to a safer level, typically around 12V AC.
3. **Resistor Network**: This network is connected to the low voltage side of the transformer to further condition the voltage for the Arduino's ADC (Analog-to-Digital Converter). The resistors should be chosen to ensure that the voltage does not exceed the maximum allowable input for the Arduino.
4. **Arduino Microcontroller**: The Arduino is programmed to sample the sine wave from the transformer output. It should be equipped with a suitable ADC to measure the voltage waveform at a sampling rate of approximately 4386 samples/s.
5. **GPS Receiver**: A GPS module connected to the Arduino using LadyAda's GPS shield provides a highly accurate reference clock, generating a pulse per second (PPS) signal.
6. **Data Logging Interface**: The Arduino communicates with a PC via a serial connection to send timestamps for analysis. The software on the PC should be capable of logging and analyzing the time data to calculate frequency variations.
7. **Power Supply for Arduino**: An appropriate power supply for the Arduino, typically 5V, should be included, ensuring it is isolated from the high voltage side of the circuit.
The schematic should illustrate the connections between these components, highlighting the isolation provided by the transformer and the importance of the resistor network in protecting the Arduino. Additionally, the schematic should depict the data flow from the Arduino to the PC for frequency analysis, emphasizing the role of the GPS receiver in providing a stable reference for accurate measurements.Wall sockets supply power in the form of a 230 volt sine wave. The frequency of this sine wave is supposed to be 50 hertz. In other words, the voltage on the socket alternates between positive and negative at a rate of 50 full periods per second. (At least this is how it works in the Netherlands; many countries use different frequencies and/or voltages.
) There are clocks, so-called synchronous clocks, that count voltage alternations to determine the passage of time. Is the grid frequency accurate enough to keep such clocks running right I used an Arduino to measure the frequency of the sine wave from a wall socket.
To avoid working with dangerous high voltage, I used a transformer from an old halogen lamp. The transformer is plugged into the wall socket, and the low voltage side of the transformer is hooked up to the Arduino through a resistor network. The Arduino measures the sine wave at about 4386 samples/s. Whenever it detects a rising zero-crossing edge in the sine wave, it sends a timestamp to the PC. Some kind of reference clock is needed to measure the frequency of a signal. The Arduino has an on-board clock crystal but I was not sure about it`s accuracy. So I decided to use a GPS receiver as my reference clock. It generates a pulse per second (PPS) with very high accuracy. The GPS receiver is connected to the Arduino by means of LadyAda`s excellent GPSshield. When the Arduino detects a time pulse from the GPS receiver, it sends a timestamp from its on-board clock to the PC.
Software on the PC uses these timestamps to detect variations in the rate of the Arduino board clock. The GPS signal is not strong enough for indoor reception unless the receiver is very close to the window, so I built the test setup in the window sill.
I let it run for 8 days while recording data to a file on the PC. The average frequency actually looks pretty good: 49. 99994 Hz is only about 1 part-per-million away from 50 Hz. However, note that this is the average over the whole 8-day measurement. A different figure emerges when we look at the 24-hour averages. It turns out that there is significant day-to-day variation in the average frequency. The frequency variation affects synchronous clocks. On some days the clocks run too fast, on other days they runs too slow. Although the frequency deviation is small, its effect builds up over time. A synchronous clock would have drifted up to 16 seconds away from real time during the 8-day measurement. There are three peaks in the plot of the momentary frequency. At these points, the grid frequency jumped to almost 100 Hz for just a single period of the sine wave.
I don`t understand what happened there. Since there is a relation between grid frequency and load balance (see below), I thought there may also be a relation to the voltage. However a scatter plot of voltage versus frequency does not reveal a pattern. It just looks like a typical Rorschach blob. Supply and demand of electrical power must always be kept in balance. This is done through a mechanism called droop speed control. The power generators in a grid are synchronous, i. e. operating at the same frequency. When demand for power increases, the generators in the grid slow down a little bit and the frequency goes down.
This is detected in the power stations, and the production of the generators is increased to compensate. As a result, the frequency of the grid is kept close to 50 Hz and at the same time power production is kept in balance with power demand.
A more detailed explanation can be found in this article about power grid principles. The point is that the frequency of the grid depends on the balance between supply and demand. Although the grid operators keep the momentary frequency close to 50 Hz, they don`t even try to keep the average frequency at 50 Hz. The primary purpose of frequency control is load balancing, not time keeping. There is in fact an additional control 🔗 External reference
Related Circuits
The RF engineer often needs an instrument that can reliably and quickly check a low-frequency quartz crystal unit. However, such equipment is challenging to find, and engineers frequently refer to electronic circuit handbooks for schematics that can perform this...
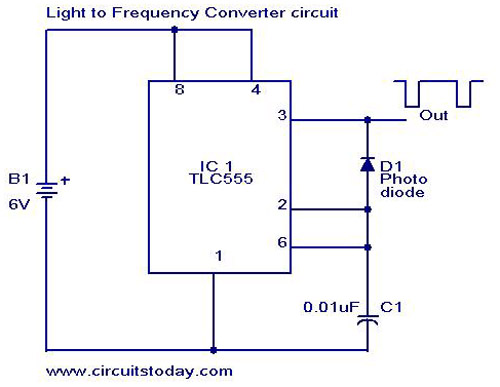
A simple light-to-frequency converter circuit with a diagram and schematic. It is used as a light intensity measurement circuit. The design utilizes the TLC555, a CMOS version of the NE555 timer IC. The light-to-frequency converter circuit is designed to convert...
The circuit was designed to create a frequency generator that consists of seven steps during operation. It includes a crystal oscillator, which is an electronic circuit made of... The frequency generator circuit operates through a series of seven distinct steps,...
A frequency doubler can be constructed using a single 4069 hex inverter IC, resulting in an output pulse train with a frequency that is twice that of the square wave input signal. The frequency doubler circuit utilizing the 4069 hex...
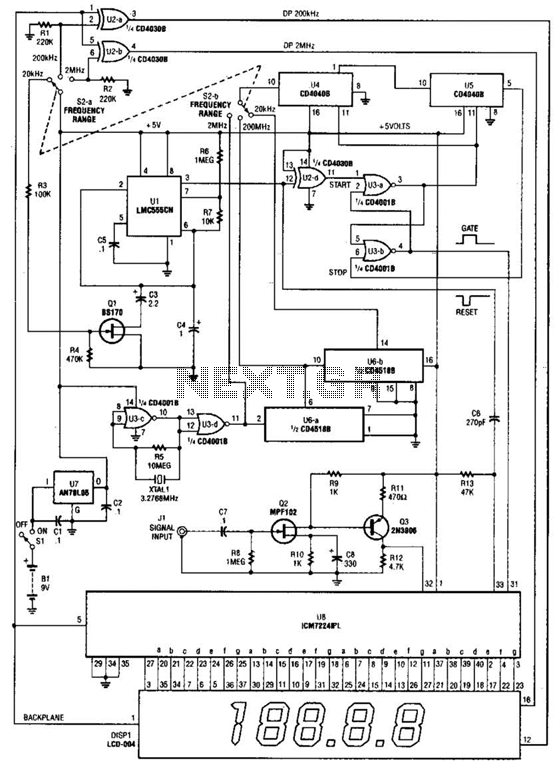
This is a schematic and block diagram of a 2-MHz frequency counter. It utilizes an LSI counter/display driver, an LCD readout, and several logic chips for timebase and timing pulse circuitry. Q2 and Q3 serve as a signal (input)...
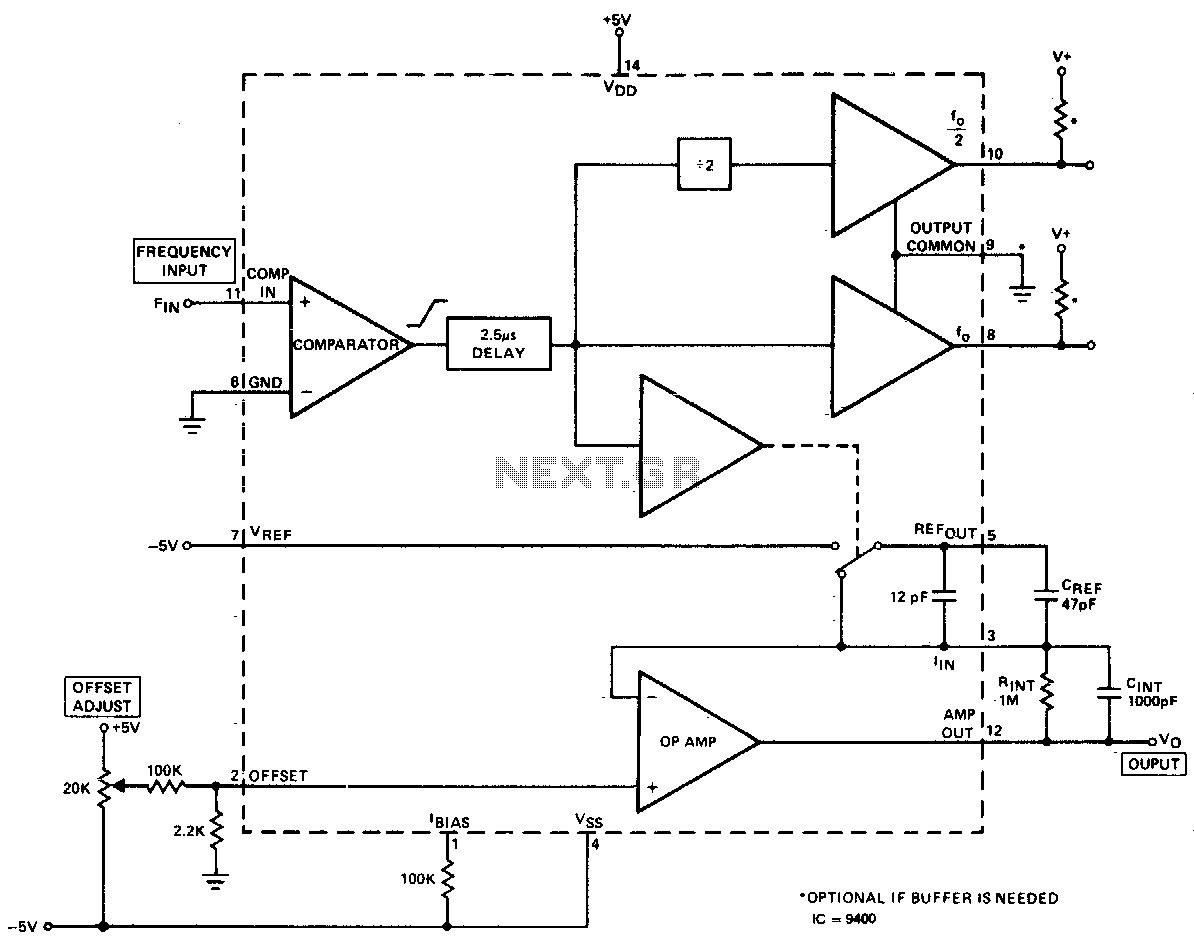
The converter produces an output voltage that is linearly proportional to the input frequency waveform. Each zero crossing at the comparator's input results in a specific amount of charge being dispensed into the op-amp's summing junction. This charge subsequently...
Warning: include(partials/cookie-banner.php): Failed to open stream: Permission denied in /var/www/html/nextgr/view-circuit.php on line 713
Warning: include(): Failed opening 'partials/cookie-banner.php' for inclusion (include_path='.:/usr/share/php') in /var/www/html/nextgr/view-circuit.php on line 713